The Trading Bible Trading Guides Forex Line Trading - How To Use Trend Lines In Trading
Forex Line Trading - Meaning, Uses, and Strategy
By TheTradingBible.com, Updated on: Mar 23 2025.
Trading Forex can feel like you're lost at sea without a compass sometimes. All those short-term zig-zagging price movements and complicated technical indicators are enough to make any new Forex traders’ heads spin!
But have no fear, learning how to use trend lines in Forex trading is actually one of the simplest - and most powerful - weapons in your trading toolbox.
Used correctly, Forex line trading can help you spot profitable trading opportunities in the market like a sniper and just as importantly, protect you from entering losing trades that go against the trend.
The key is drawing your trend lines the right way.
You want to identify areas where the price has bounced off support and resistance OVER TIME.
Not just once or twice - we're looking for the highway of the market here.
Connect those significant swing points, and you've got a trend line that can show you where the price is likely headed.
Of course, the Forex market loves to misbehave and trends don't last forever so you've got to stay nimble!
By the end of this Forex trend line trading strategy guide, you’ll not stumble around without a clue which way the price action winds may blow next! Let’s dive in and get you to learn what do the lines mean in Forex trading and get you drawing your first winning trend lines.
What Is Forex Line Trading
At its core, Forex line chart trading refers to the technical analysis technique of drawing straight lines on price charts to connect significant swing highs and lows. The trend line strategy in Forex trading allows traders to identify areas of support and resistance that can provide valuable insights into market behavior.
More specifically, there are two main types of trendlines used in Forex line trading:
- In an uptrend, you'll draw your line along the bottom of the low swing points (ascending trendline), connecting the valleys. As the price bounces off this support line over time, it shows you the direction is heading upwards.
- On the flip side, in a downtrend you'll draw your line along the tops of the swing high points (descending trendline), connecting the peaks. As the price gets rejected off this resistance line, it indicates the overall direction is heading down.

Buying near the rising support trend line indicates an uptrend and selling near the falling resistance trend line indicates a downtrend.
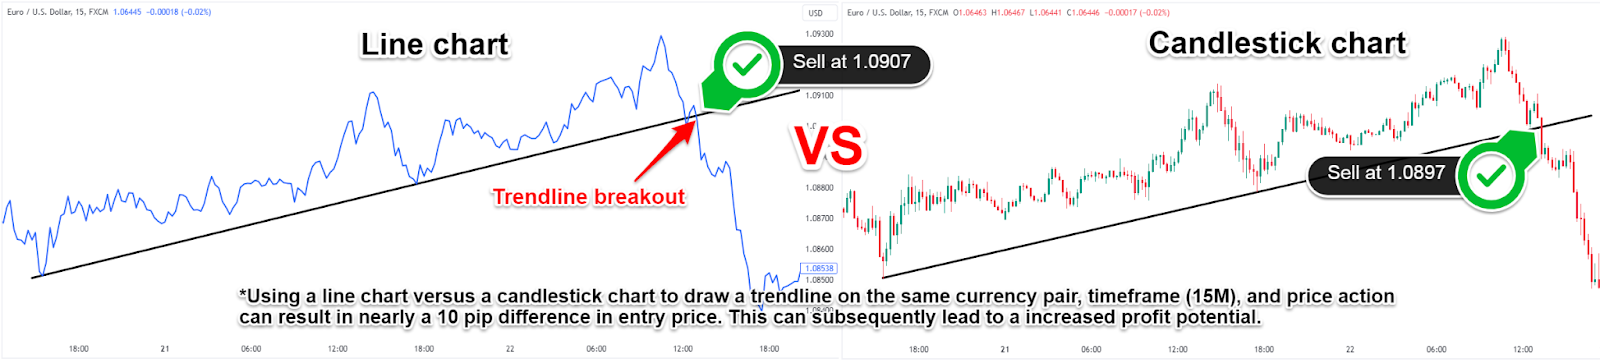
Note* Using line charts for Forex trading helps FX traders discount the candlestick wicks and only focus on the closing price to draw Forex trendlines.
Being able to correctly spot and draw these Forex trend lines takes a bit of practice. But once you get the hang of it, you'll have a valuable tool to help determine:
- The current trend direction of currency pairs
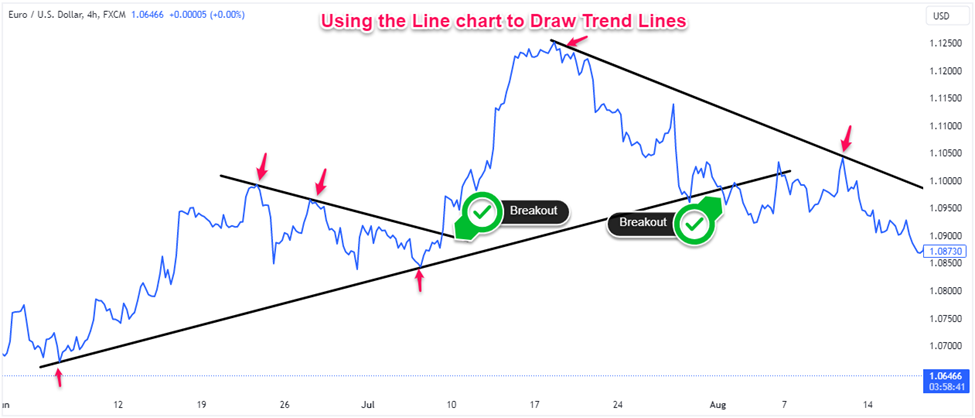
- Possible areas for entry into the trend (eg. Forex line trading breakout)
- Ideal points to take profit
- Where to place stop losses
- When a trend has lost momentum and may be reversing
Now that you know what are the price action lines in Forex trading the next step is to learn how trading trend lines in Forex works.
How to Use Trendlines for Forex Trades
Drawing accurate Forex trading trend lines is crucial in any trading strategy. Here's a straightforward walkthrough for beginner traders:
Got your chart ready?
Excellent, let's start lining!
First, you'll want to identify a clear swing high or low on the chart which will be the starting point for your trend line.
Next, find another significant swing pivot point and connect these two points with a straight line. Make sure to connect the line precisely from high to high or low to low.
And that's it! Just connect at least two pivots and you've got yourself a valid trend line. Pretty simple right?
Now I know what you're thinking. This sounds way too easy. What's the catch?
Well, there are a few key things to keep in mind when Forex trading the trend line:
- Draw your lines on the bodies of the candlesticks, not the wicks. This makes them more accurate so make sure you use the line chart Forex trading instead of the bar chart or candlestick chart.
- Don't force the trend line to fit. If the points don't make a straight line, it's not a valid trend line.
- The more times a line is tested, the weaker it becomes. Expect breakouts eventually.
- Steeper lines break more easily than gradual ones so go with angled lines when possible.
- The Forex line chart trading system works best in combination with chart patterns, moving averages, and other technical indicators (RSI, Stochastic, MACD, etc.).
Types of Trends in Forex Line Trading
When it comes to market prices regardless of the time frame used, it's crucial to understand the three major types of trends that can occur:
- Uptrends
- Downtrends
- Sideways trends.
Here's a simple breakdown of how trend line analysis Forex trading works:
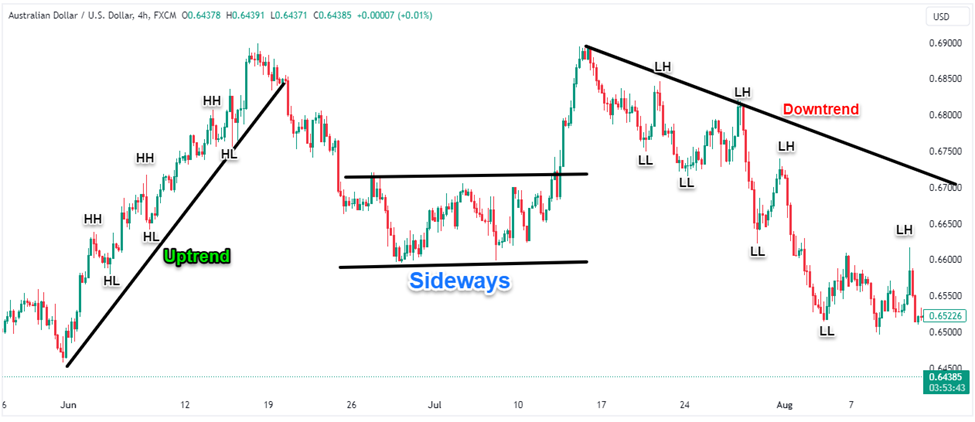
Uptrend
First up, we have uptrends. This is when the price is steadily moving higher over time. On the chart, you'll see a series of higher highs and higher lows as the bulls take control. Your uptrend lines will connect these low points.
Downtrend
The opposite of uptrends, in a downtrend the price is steadily dropping over a period and it's characterized by lower lows and lower highs on the chart as the bears take over. Your downtrend lines will connect these high points southward.
Sideways
Finally, we have sideways or range-bound markets and as the name suggests, the price is moving sideways between support and resistance levels, unable to establish a clear trend direction. Traders often wait for a breakout before entering range-bound markets.
Forex Line Trading Indicators
The top Forex line indicator and trading system that can really bring your Forex chart analysis to the next level:
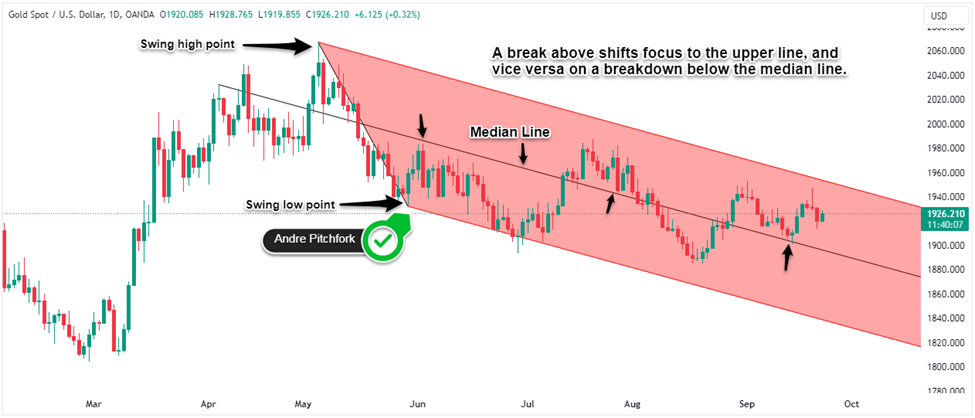
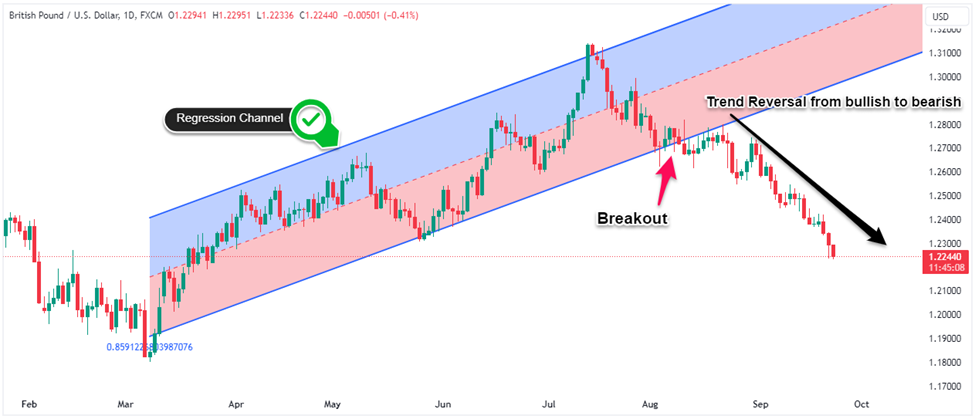
- Linear Regression Channel - These add a middle median line between 2 regression lines upper and lower. The median line gives a center point calculated from the closing prices. Angled channels based on linear regression line can spot divergences from the overall trend.
- Parallel Channels - This just takes your existing trendline and clones it parallel up and down from the price giving you clear levels where breaks and bounces may occur. Super straightforward.
- Median Line - A median line is drawn between two price extremes (high and low) to form the bisector or midpoint of the price range. It is a fancier version of parallel channels using some math wizardry giving you a median line between the support and resistance. More angled channels can help spot divergences.
If you’re Forex day trading trend lines you may be getting overwhelmed wondering which of these is the perfect solution.
Let me tell you, there's no magical trend line indicator that will scream "buy here!" or "sell now!".
Don't drive yourself crazy trying to find one.
The key is picking 1 or 2 you like and using them to CONFIRM your trend line analysis but don't rely on them alone to make trading decisions. Instead, mix it up to fit your trading style and Forex trading trend line strategy!
Forex Line Trading Examples
Forex trading using line chart example:
Linear regression Forex trading example:
Median line Forex trading example