The Trading Bible Blog ᑕ❶ᑐ Inverted Head and Shoulders Pattern Meaning for Traders
Inverse Head and Shoulders Pattern - Head and Shoulders Bottom
By Stelian Olar, Updated on: Jul 12 2024.
Have you ever noticed a pattern forming on a price chart that looks like an upside down head with shoulders on either side?
If so, you may have spotted the notorious inverse head and shoulders pattern.
This powerful formation signals an upcoming trend reversal and presents juicy trading opportunities.
I remember when I first started looking at charts years ago, the multitude of chart patterns and formations felt overwhelming! But once I learned how to spot the inverse head and shoulders, it became one of my favorite setups to trade.
But what exactly does this pattern look like?
And what is the inverse head and shoulders meaning for traders like you?
Let's break it down.
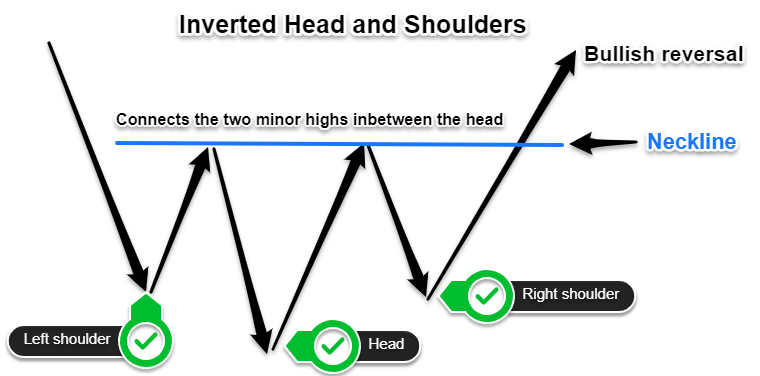
The inverted head and shoulders is a bullish reversal pattern that marks the transition from a downtrend to an uptrend. It gets its name from its distinct shape - three swing lows that look like a head in between two shoulders. When the neckline is broken, the pattern is complete and the security is expected to rise.
In this article, we'll explore what inverse head and shoulders patterns are, how to spot them on charts, and how to take advantage of them in your own trading. You'll learn key details like ideal entry, stop loss, and take profit levels.
If you want to capitalize on this high-probability reversal setup, you'll need to understand the inverse head and shoulders pattern inside and out.
So let's dive in and uncover the secrets of the inverted head and shoulders pattern!
What is an Inverse Head and Shoulders Pattern
An inverse head and shoulders pattern forms at the end of a downtrend as a signal the bearish trend is about to reverse into an uptrend. They are bullish reversal patterns identified in technical analysis.
This pattern appears on a chart as three swing low points, with the head (middle low) below the two shoulders patterns (outer lows) and the neckline is drawn connecting the two high points of the two shoulders. 
When the price breaks the neckline after forming the pattern, it signals the downtrend has ended and an uptrend will likely begin. The inverse head and shoulders indicates potential for a bullish breakout.
Traders watch for inverse head and shoulders patterns to anticipate coming reversals. Spotting this pattern early and entering trades based on the buy signals can lead to profitable opportunities.
Now that you know what the inverse head and shoulders is, let's look at how to properly identify it and the key components to analyze.
Components of an Inverse Head and Shoulders Pattern
There are a few key components to identify in order to properly spot an inverse head and shoulders pattern:
- The prevailing downtrend
- First shoulder
- The head
- Second shoulder
- Neckline
- The new uptrend
The Prevailing Downtrend
The inverse head and shoulders pattern forms within a prevailing downtrend - a period of lower swing highs and lower swing lows. Identifying this downward trajectory is the first step to recognizing the potential bottoming pattern.
Volume is usually high during this downtrend.

First Shoulder
The first shoulder forms the initial trough and indicates the market may be bottoming. However, the downtrend hasn't reversed yet. This first swing low is an important reference point for spotting the pattern.
Volume starts decreasing during the formation of the left shoulder. 
Head
The head marks the lowest point where prices move even lower, making the second major price dip in the pattern. It is lower than both shoulders and it represents the deepest retracement of the downtrend before reversing.
Volume increases significantly during the formation of the head. 
Second Shoulder
The formation of the second shoulder suggests the market may be bottoming. This right shoulder bottoms around the same price level as the left shoulder did previously.
And, here is the kicker – volume starts decreasing during the formation of the second shoulder. 
Neckline
The neckline is drawn by connecting the highs of the two shoulders. This line marks the key resistance level the price needs to break to complete the reverse head and shoulders pattern.
The neckline can be horizontal but is often ascending or descending at various angles.
The New Uptrend
When the price successfully breaks above the neckline, it signals the downtrend has ended and the market has begun shifting into a new uptrend as the price rises. Breaking the neckline confirms the pattern and reversal. 
Carefully analyzing each component helps traders reliably spot reverse head and shoulders and the upcoming trend reversals they precede.
Inverse Head and Shoulders Formation
Now that we've broken down what an inverse head and shoulders pattern looks like, let's see some real examples of how this formation takes shape. Observing actual price action and how this pattern develops is crucial.
Example 1: Bitcoin (BTC)
In June 2019, Bitcoin formed an inverted head and shoulder on its daily chart. The left shoulder formed first, followed by the head marking the lowest point. The right shoulder matched the left shoulder, and the neckline angled upward.
When Bitcoin's price successfully broke above the ascending neckline in July, the reverse head and shoulder pattern was confirmed. This triggered the start of an uptrend. 
Example 2: USD/CAD
On the USD/CAD 4-hour chart, an inverse head and shoulders formed in July 2022. The left shoulder bottomed on June 27th, the head bottomed on July 14th, and the right shoulder bottomed on July 31th.
The neckline was descending. In early August, USD/CAD closed decisively above the neckline to complete the pattern. This confirmed the reversal and kickstarted an uptrend in the US dollar against the Canadian dollar. 
As you can see from these examples, spotting clean inverse head and shoulders patterns in real trading environments takes practice, but mastering this reversal pattern can unlock profitable opportunities.
Now let's discuss the difference between inverse head and shoulders bullish or bearish.
Inverse Head and Shoulders - Bullish or Bearish Pattern?
The inverse head and shoulders is considered a bullish reversal pattern because it signals that a downtrend is likely ending and an uptrend is beginning.
While the regular Head and Shoulders Top formation indicates a bearish reversal, the inverse head and shoulders or Head and Shoulders Bottom is the exact opposite - a bullish sign.
Traders watch for the inverse head and shoulders during:
- market selloffs,
- corrections,
- or downtrends.
When the pattern completes, it suggests the market has bottomed and upward momentum is likely to follow.
So whenever you spot this pattern taking shape during a downward move, know that it represents a high-probability reversal setting up. Use the inverse head and shoulders to gain an edge right from the start of bull markets!
How Reliable Is the Inverted Head and Shoulders Pattern
When formed correctly, the inverse head and shoulders pattern reversal succeeds in calling the end of a downtrend about 60-75% of the time. Those are relatively good odds for a price action pattern, but like any chart pattern, it's not foolproof.
Multiple statistical studies have analyzed the reliability of the inverse head and shoulders pattern in different financial markets:
- In one study, the inverse head and shoulders produced the correct reversal prediction 62% of the time. The expected uptrend occurred in about 6 out of 10 instances.
- Another analysis found the pattern was accurate 75% of the time for stocks specifically. When formed correctly, 3 out of 4 inverse head and shoulders marked the end of downtrends.
- For commodities like gold and oil, the success rate has been measured closer to 70%.
- Some research even suggests an accuracy rate up to 80% if strict pattern confirmation rules are followed.
False breakouts above the neckline do occur and, there are times when the pattern ends up failing and the expected upside breakout never materializes.
Factors that can reduce the reliability and can lead to a failed inverse head and shoulders pattern include:
- poor placement of the shoulders,
- sloppy formation,
- or the breakout lacking conviction and volume.
To boost your odds, look for inverse head and shoulders with perfect symmetry, clear volume reductions on the shoulders, and a decisive breakout with expanding volume.
Advantages and Disadvantages of the Head and Shoulders Pattern
The inverse head and shoulders, like any chart pattern, comes with both pros and cons for traders. Let's examine these key advantages and disadvantages:
Advantages:
- Provides early warning of trend reversals - Spotting the pattern can tip traders off to an upcoming breakout.
- High probability setup - Correctly formed patterns succeed 60-75% of the time.
- Clear entry point - The neckline breakout signals when to enter trades.
- Price target guidance - The pattern provides an estimate of potential price targets.
Disadvantages:
- Subject to false breakouts - The neckline may be breached but the pattern fails.
- Requires pattern recognition skills - Traders must be able to spot the shoulders chart pattern reliably.
- Stop loss placement not always clear - Determining where to place stops can be tricky.
- Works best with other indicators - Combining with volume, oscillators can improve accuracy.
How to Trade the Inverse Head and Shoulders Chart Pattern
When you spot the head and shoulders pattern inverse forming, here are some tips for trading it effectively:
- Identify the left shoulder, head, right shoulder, and neckline - Analyze the pattern and draw the key levels.
- Wait for the neckline breakout - Be patient and allow the price to break above the neckline before entering.
- Enter long on a close above the neckline - Place a buy stop order to catch the upside breakout price. Alternatively, wait for a pullback to the neckline before pulling the trigger.
- Set stop loss below the right shoulder - This limits downside risk if the pattern fails.
- Take profit by measuring the distance from head to neckline - Project this height above the breakout to get your profit target.
- Manage risk - Use proper position sizing and maintain a 2:1 or 3:1 reward/risk ratio.
- Consider volume - Look for heavier volume on the upside breakout for confirmation.

Mastering these steps allows traders to reliably trade the head and shoulders pattern and time entries based on high-probability price action signals. Always employ sound risk management for optimal results.
If you're ready to start putting the inverse head and shoulders to work in your own trading, check out these leading Forex brokers:
- Pepperstone - Offers cutting-edge trading platforms and tight spreads.
- eToro - User-friendly broker tailored to US-based Forex traders.
Sign up for a risk-free demo account to test out inverse head and shoulders trading strategies before risking real capital.