The Trading Bible Blog ᑕ❶ᑐ Double Bottom Pattern in Trading - Meaning, Charts, Confirmation
Double Bottom Pattern - Meaning and Examples
By Stelian Olar, Updated on: Jul 12 2024.
Have you ever noticed stock prices bounce up after falling to the same low level twice?
This pattern is called a double bottom, and it can signal potential trend reversals in a downtrend. If you want to understand what is a double bottom in stocks and how to profit from them, you’re in the right place.
Have you ever felt like you bought a stock at the worst possible time, only to see it continue dropping lower and lower?
It's a gut-wrenching feeling watching your hard-earned money seemingly go down the drain. But what if I told you those lower lows could actually be an indicator of an upcoming reversal and rally?
In this article, we’ll explore:
- The double bottom pattern meaning,
- How to spot double bottom stocks on charts,
- How to confirm a valid double bottom pattern.
- You’ll learn key details like where to buy and place stop losses after a double bottom chart pattern forms.
- Answer if is double bottom pattern bullish or bearish?
- We’ll also look at double bottom examples
Whether you’re a beginner or an experienced trader, this guide will give you the knowledge to trade double bottoms with confidence. Understanding bottoming patterns like double bottoms can help you react quicker to shifts in market sentiment and potentially profit from upcoming rallies.
Ready to decode this powerful reversal pattern?
Let’s dive in.
What is a Double Bottom Pattern
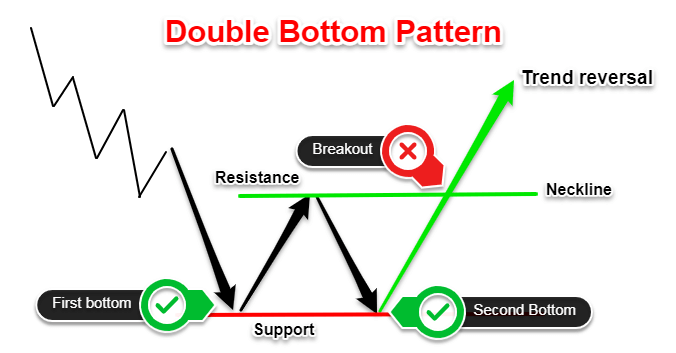
A double bottom is a bullish reversal pattern that forms after a downtrend as the price drops to form two distinct low points at roughly the same support level. The two bottoms create a "W" shape on the chart, with the lows representing the two bottom points of the W.
This double bottom stock pattern reflects bullish sentiment beginning to overcome bearish sentiment.
The double bottom reversal acts like a spring - compressing down to nearly identical lows before launching back upward in a new uptrend.
For a valid stock double bottom to form, a few key criteria must be met:
- The two lows must be at approximately the same price level, forming a horizontal support zone. This support level is key.
- There should be a moderate peak between the two bottoms, known as the "valley."
- Volume on the second low should be noticeably higher than the first bottom which suggests increased buying pressure.
- Once the second low is put in, there is a clear break above the valley's resistance with strong volume. This confirms the bullish reversal.
Note* Another variation on the standard double bottom pattern is the Adam and Eve double bottom pattern where the second bottom (Eve) undercuts the first bottom (Adam) before a breakout over the peak between the two bottoms confirms the uptrend. Eve exhausting the sellers allows buyers to regain control.
When these conditions are met, the bullish double bottom pattern signals that buyers have stepped in at support and the prior downtrend is likely over. The resulting breakout can lead to a prolonged upside move and new uptrend emerging.
Being able to recognize this bullish chart pattern is a core skill in technical analysis and a key weapon for stock traders.
Now, let’s move forward and see what does a double bottom indicate and how to identify one.
How to Identify Double Bottom Pattern
Step-by-step guide to spotting multiple bottom pattern for rookie traders:
#1 Find a Stock in a Downtrend
First, scan for stocks (or your favorite currency pairs, cryptocurrencies, etc.) that are in a clear downtrend showing signs of seller exhaustion. The double bottom signals a transition from downtrend to uptrend, so finding a stock already in a downtrend is key.
#2 Look for 2 Clear Lows
Look for two clear lows or troughs at roughly the same price zone which will form the twin bottoms. Volume on the second bottom should show a noticeable spike, reflecting increased buying pressure as bulls defend support.
#3 Check the Distance between the Bottoms
Make sure decent time passes between the two lows - don't confuse minor fluctuations for the bottoms.
#4 Draw the Neckline
Draw a line at the peak between the lows to mark the resistance level to watch.
#5 Double Bottom Technical Analysis
Check indicators like moving averages or RSI to confirm bullish divergence on the second low.
Only trade double bottom stock with the existing downtrend, not against a strong bullish trend.
Patience is key!
Double Top and Double Bottom Patterns - Know the Difference
It's crucial to understand the differences between double top and double bottom chart patterns. Though they share some traits, they have very different trading implications.
A double top chart pattern is formed when the price rises to hit resistance at roughly the same peak level twice, creating an "M" shape on the chart. This is considered a bearish reversal pattern.
Unlike the bullish double bottom, a double top signals potential exhaustion of an uptrend indicating that buyers could not push the price above a key resistance zone twice, despite reaching similar peaks.
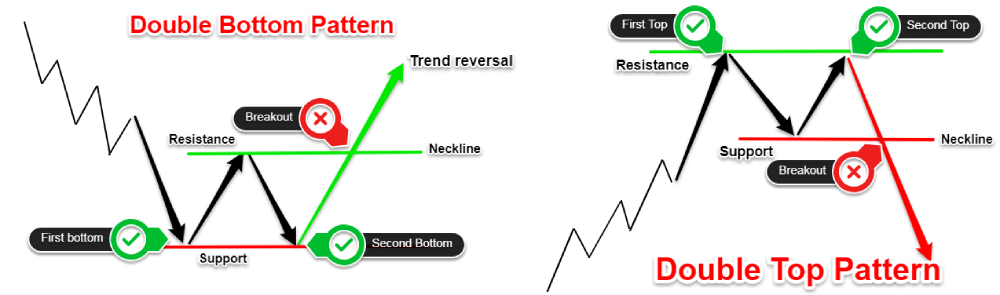
This means the double bottom is a bullish pattern, while the double top is bearish.
This means double bottoms present opportunities to go long, while double tops can prompt exiting long positions or taking short positions to capitalize on the developing downtrend. Understanding these key distinctions is foundational when analyzing charts and identifying trades.
This answers the question:
Is double bottom bullish or bearish?
Traders can also watch for triple top and triple bottom chart pattern, which are similar but with three troughs or peaks instead of two.
How to Trade the Double Bottom Pattern
Now that you know how to identify the double bottom Forex pattern, let's discuss how to actually trade these chart patterns for profits. Here are some tips:
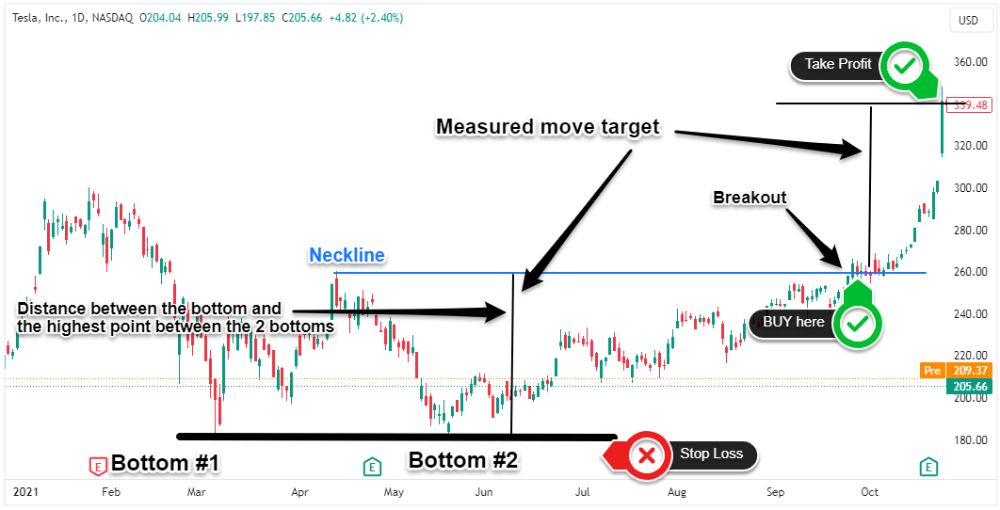
- Wait for price breaks above the highest point between the two bottoms before entering a trade. This breakout confirms the double bottom.
- Place the stop loss orders just below the second trough of the double bottom pattern to control risk in case you’re dealing with a failed double bottom pattern.
- Target taking profits near the same height as the distance between the bottom and the breakout point. This projects the potential measured move.
- Actively manage the double bottom trade as the stock climbs post-breakout. Book partial profits along the way up, trailing the stop under rising supports.
- Focus on high volume stocks with strong breakouts to improve odds the new uptrend continues and avoid weak breakouts.
- Wait for clear double bottom confirmation before entering any trades to confirm the bottom is in.
With the right approach, double bottom trading can lead to highly profitable trades if you target key entry points, use smart stops, and book profits along the way up.
Using Double Bottom in Technical Analysis
Here are some key ways traders use the chart double bottom as part of an overall technical approach in the stock market:
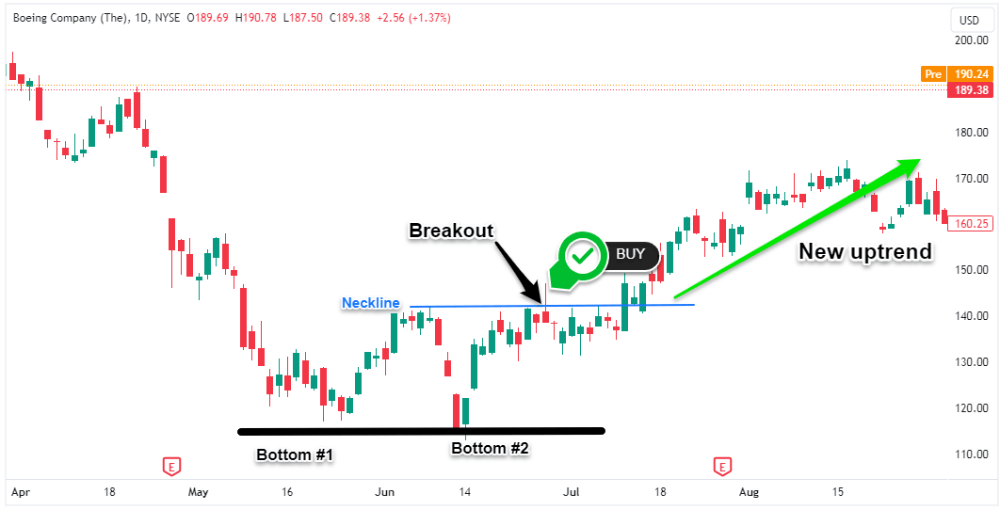
Spotting a textbook stock market double bottom warned of an upcoming uptrend in Boeing’s stock price in June 2022, providing an early trading opportunity.
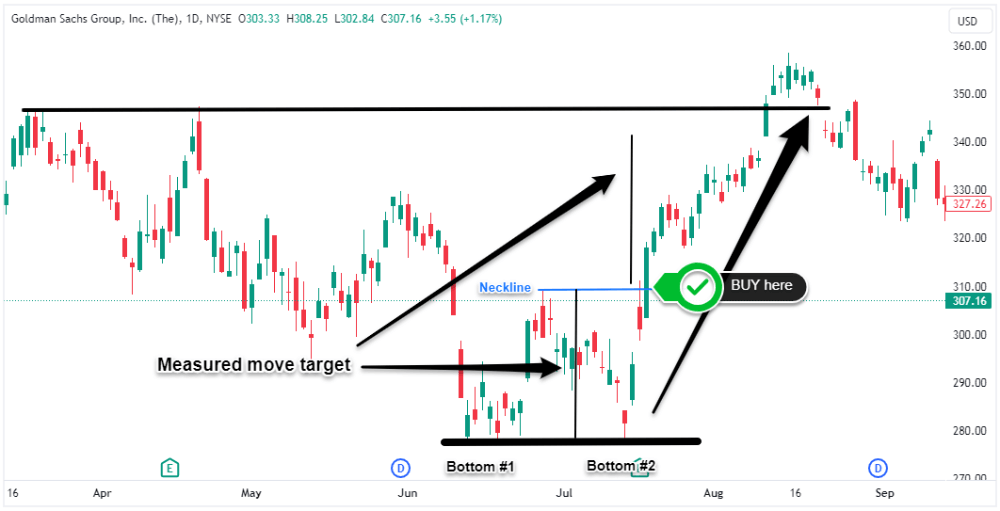
The projected measured move for Goldman Sachs’ double bottom in July 2022 highlighted upside potential back to the prior highs, which played out over the next few weeks.
Seeing real-world examples makes it much easier to envision how to effectively utilize the pattern in technical analysis. When you trade the double bottom technical analysis is a must.
Double Bottom Pattern - Effective Trading Strategies
When you identify a high probability double bottom pattern stocks, here are four solid trading strategies to consider:
The Breakout Strategy
Enter stocks showing double bottom breakout pattern once price closes above resistance. Enter a buy stop order just above resistance after the second low forms and target taking partial profits at the projected measured move and trail SL for the remaining position.

The Pullback Strategy
Wait for a pullback to the breakout level to time the double bottom entry.

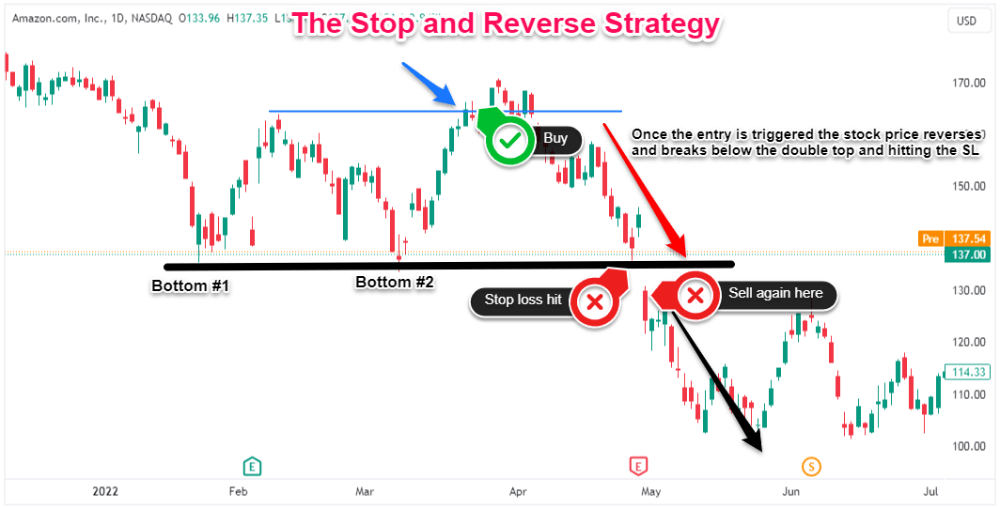
The Stop and Reverse Strategy
If the pattern fails, enter a short trade on a stop out below support with a target at recent swing lows. This is a more advanced approach because it requires going against the double bottom pattern bearish signal.
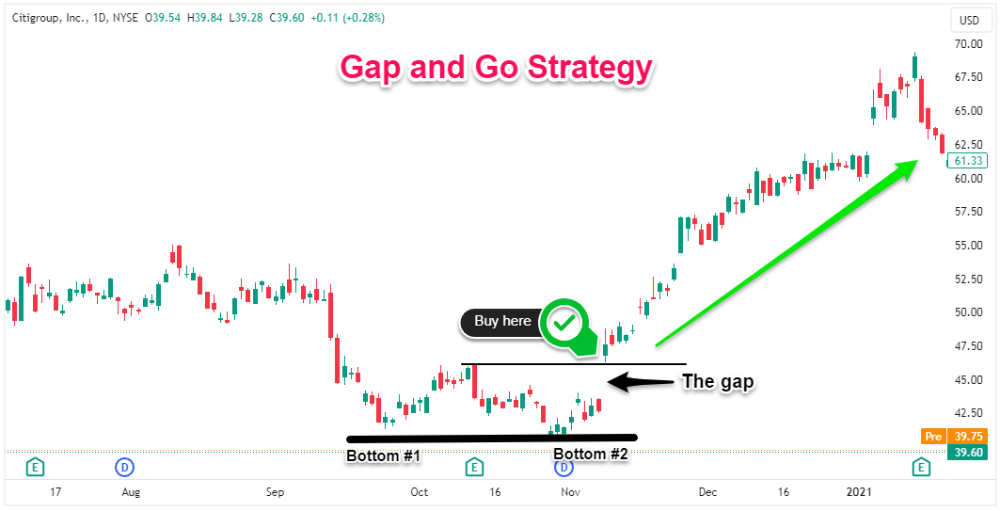
The Gap and Go Strategy
Trade the clean breakouts from double bottoms that gap up through resistance. The heavy breakout volume signals strong double bottom continuation pattern.
Implementing structured, rule-based strategies like these when you spot a high probability double bottom pattern can lead to consistent profits.
Some traders interested in Forex and technical analysis may benefit from researching brokers with trading platforms optimized for spotting chart patterns like Pepperstone or eToro (for US residents). However, it's always important to thoroughly vet any broker based on factors like regulation, reputation, and costs prior to opening an account.