The Trading Bible Trading Guides ᑕ❶ᑐ Bearish Candlestick Patterns: Formation and Indicators
Bearish Candlestick Patterns You Need to Know
By Stelian Olar, Updated on: Jul 12 2024.
In this article, we'll explore must-know bearish candlestick patterns. Knowing these formations helps you spot potential reversals and downside momentum early.
Who doesn't want the superpower to identify impending price drops?
By the end, you'll have candlestick pattern recognition down pat whether you're a novice or experienced trader, this refresher helps fine-tune your skills.
We'll cover classics like the shooting star candlestick, dark cloud cover, and inverted hammer candlestick pattern. There are over a dozen bearish reversal candlestick patterns in total, some more popular than others. I'll share the most useful to know as you monitor price actions.
Learning key patterns makes you a better bearish candlestick reader overall:
- You gain insight into how buyers and sellers battle it out based on those iconic boxes and lines.
- Things like wick size and relationship to other bars reveal so much about market psychology!
Let's dive into this candlestick crash course!
Understanding these candlestick bearish reversal patterns helps spot potential tops, reversals, and down moves early. Give your chart reading skills a boost as you learn to recognize all bearish candlestick patterns that hint downside's ahead.
What Are Bearish Candlestick Patterns
In candlestick charting, Bearish candlestick patterns are specific formations of one or more candlesticks on a price chart that suggest a higher likelihood of a downward price movement. These patterns are recognized by traders as potential indicators of:
- Weakening of an uptrend.
- Or reversal of an uptrend.
- Or downtrend continuations.
The term "bearish" is used because it often signals a shift toward bearish sentiment in the market, indicating that sellers are gaining control over buyers.
Key Characteristics of Bearish Candlestick Patterns:
- Reduction in Buying Interest: Bearish patterns typically suggest a decrease in buying interest or a surge in selling pressure, which can lead to a decline in asset prices.
- Reversal Indicators: Bearish candlestick patterns are often seen as reversal indicators, meaning that they signal a potential change in the direction of price movement. They can help traders identify opportunities to go short or exit long positions.
- Pattern Variations: Bearish candlestick pattern come in various forms, with each having its own characteristics. Some common bearish patterns include the Bearish Engulfing Pattern, Dark Cloud Cover, and Evening Star candlestick, among others. These patterns differ in terms of candlestick arrangements, but they all convey a bearish bias.
Mastering key bullish and bearish candlestick patterns gives you an edge. You can gauge supply/demand dynamics and spot turns early.
Let's explore the top bearish candles and what they imply!
Key Bearish Reversal Candlestick Patterns to Know
Now that you know what comprises a bearish reversal candlestick, let's explore popular reversal patterns. These signal potential trend changes from bullish to bearish.
Bearish Engulfing Candlestick
- Two candle formation
- First candle has a small green/white body
- Second candle has a large red/black body that engulfs the body of the first candle
- Shows a transition from buying pressure to selling pressure

Bearish Evening Star Candlestick:
- The bearish evening star candlestick pattern is a three candle formation
- First candle has a large green/white body
- Middle candle has a small bodied that gaps below previous day candle
- Third candle has a large red/black body that closes well into the first candle's body
- Signals indecision followed by a bearish breakdown

Bearish Hammer Candlestick:
- The bearish hammer candlestick pattern is similar to the Hanging man
- Only one candle
- Has a small green/white body near the top of the trading range
- Long lower wick below the body
- Indicates buying pressure was rejected and reversal may occur

Bearish Inside Bar Candlestick:
- Two candle formation
- Second candle's high and low are completely contained within the high and low of the previous candle.
- Shows contracting price action and indecision
- Often resolves downward after contraction

Bearish Kicker Pattern:
- Bearish kickers are two candle formation
- First candle of the bearish kicker candlestick pattern has a tall green/white body
- Second candle gaps lower on the open and has a red/black body
- The body of the second bearish kicker candlestick does not overlap the body of the first candle
- Indicates a dramatic shift from buying pressure to selling pressure
- Often leads to a downward price trend
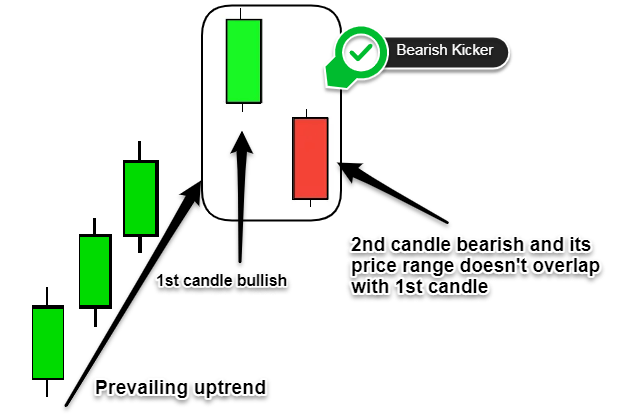
If you want to identify a bearish kicker look for the second candle gapping significantly lower than the close of the previous candle, showing an abrupt change in market sentiment. The lack of overlap between the candle bodies emphasizes the surprise negative news that triggered the selloff. The reverses are the bullish kickers which are powerful bullish reversal signals.
Other Types of Bearish Candlestick Patterns
In addition to reversal patterns, there are candlestick formations that reflect continued selling pressure and confirm ongoing downtrends. Let's outline a few of these bearish continuation candlestick patterns:
Bearish Harami Candlestick Pattern:
- Two candle formation
- First candle has a large green/white body
- Second candle has a small red/black body that fits inside first candle's range and has a gap.
- Shows contraction after downtrend, indicating uncertainty

Bearish Doji Candlestick Pattern:
- Single candle has small body near center of range
- Long wicks above and below body show indecision
- Lack of directional conviction is bearish in uptrend
- There are other variations of the doji candle like the bearish dragonfly doji candlestick pattern.

Bearish Marubozu Candlestick Pattern:
- Single candle has a long red/black body
- No upper or lower wicks
- Reflects sustained selling pressure from open to closing price

Bearish Inverted Hammer Candlestick Pattern:
- Long upper wick above small body
- Little or no lower wick
- Indicates failure to push prices higher
- Foreshadows potential reversal
In addition to the chart patterns discussed, there are many other more obscure bearish candlesticks to be aware of, such as the bearish piercing candlestick pattern, bearish belt hold candlestick pattern, bearish breakaway candlestick pattern, bearish meeting line candlestick pattern that some may be less known.
What Is the Most Reliable Bearish Candlestick Pattern
While all bearish candlesticks have some predictive value, research shows certain patterns tend to be more reliable.
One study found the bearish pin bar candlestick pattern produced winning short trades nearly 70% of the time, with an average gain per trade of 1.2R. The large wick reflects strong rejection of higher prices.
Bearish gap down candlestick pattern is also statistically powerful, with one analysis showing opening gaps down led to further losses over 60% of the time. These gaps act as breakaway gaps signaling a rush for the exits.
In addition to strong individual performance, combining a bearish pin bar with the bearish counterattack candlestick pattern, it gives very high conviction for the bearish move.
Of course, proper confirmation with supporting indicators is still essential. But statistically speaking, the pin bar candlestick pattern, gap downs and bearish counterattack patterns are among the most dependable candlestick formations.
Risks Associated with Trading Bearish Candlestick Patterns
While the bearish reversal candlestick pattern offers helpful insight, there are some risks to be aware of when trading them with the obvious one being that it doesn’t guarantee 100% that a top is in place.
It's essential to combine candlestick analysis with other technical and fundamental confirmation. Acting on candlesticks alone increases the odds of premature entries and false signals.
In addition, bearish candles are most valid within the context of an established uptrend. Sporadic bearish and bullish candlesticks in a range or downtrend are less actionable.
Finally, don't forget the cardinal rule - plan the trade and trade the plan because even reliable patterns should be traded with proper risk management using stops and defined risk/reward ratios.
How to Trade Bearish Candlestick Patterns
Now that you know how to identify key [bearish candlestick patterns], let's discuss ways to implement them. Here are some tips:
- Use a bearish candlestick pattern indicator or a bearish candlestick patterns cheat sheet for quick recognition. Having a visual aid helps spot formations faster.
- For reversal candlestick patterns, wait for confirmation before acting. This could be a break of support, moving average cross, or other signal verifying the upside exhaustion.
- Incorporate additional analysis like volume, momentum oscillators, and trend lines to validate the candlestick signal. Don't make decisions on the candlestick alone.
- Determine upside targets and downside stop levels in advance based on recent price swings or technical levels.
- Consider time frame - smaller period charts help fine-tune entry while higher time frames define overall trend.
With the right tools and confirmation, trading bearish candlestick patterns can give you an edge in gauging sentiment shifts.
Add it to your technical toolkit!
Ready to start trading the markets? Open an account with Pepperstone, an award-winning forex and CFD broker, to access fast execution speeds, low spreads, and cutting-edge trading platforms – US residents check eToro.