The Trading Bible Trading Guides ᑕ❶ᑐ Hammer Candlestick: Patterns, Meaning, Formation
What is a Hammer Candlestick - Meaning, Types, How To Trade
By Stelian Olar, Updated on: Mar 26 2025.
Have you ever looked at a candlestick chart and wondered what that strange-looking candle with the long lower wick was?
If so, you’ve probably encountered the hammer candlestick pattern. These unique-looking candles can seem mysterious at first, but they actually provide powerful trading signals when you understand how to interpret them.
In this article, we’ll explore everything you need to know about hammer candlesticks—from what is a hammer candlestick and how they form to the trading strategies you can use when you spot them. By the end, you’ll have the skills to identify candlestick hammer pattern on a chart and trade them with confidence for potential profits.
Whether you’re a beginner learning to read candlestick charts or a seasoned trader looking to refine your strategy, this guide on the hammer candlestick has something for you. You’ll learn key details like:
- What makes the hammer candlestick unique and the hammer candlestick meaning
- The bullish and bearish meaning behind hammer patterns
- How to combine hammer signals with other indicators for high-probability trades
- Effective strategies to trade the hammer candlestick pattern
Mastering candlestick patterns hammer could provide a major boost to your trading performance. The hammer acts as a powerful indicator that price may be reversing, allowing you to potentially profit from the shift.
Let’s get started!
Hammer Candlestick Meaning
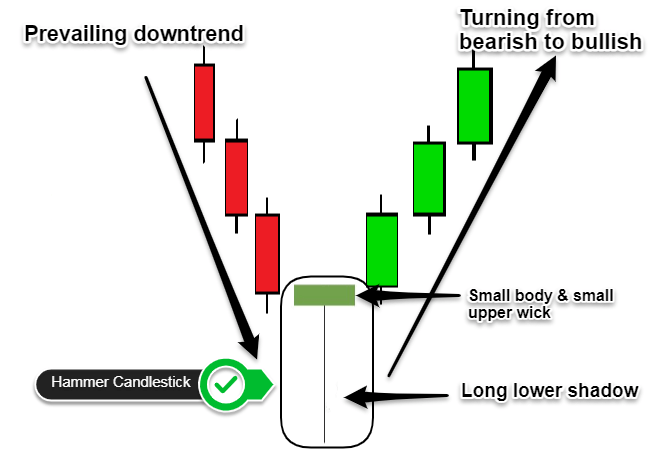
In technical analysis, the hammer candlestick forms when price moves significantly lower after the open, but buyers are able to push the price back up to close near the open. This results in a candlestick with a long lower wick or “shadow” and a small real body at the top of the range.
Note* The reverse hammer candlestick is the shooting star or hanging man pattern. Unlike the hammer, the shooting star is a bearish reversal signal that has a small lower shadow and a long upper wick.
This candlestick pattern hammer provides strong evidence that sentiment has shifted from selling to buying. The long lower wick shows that sellers initially pushed the price down sharply, but buyers were able to absorb all that selling pressure and push the price back up by the close.
When a candlestick hammer occurs at the bottom of a downtrend or at support, it signals waning selling momentum and potential for an upside reversal. The long lower shadow represents a failed attempt by bears to push the price lower.
In contrast, the candlestick hammer meaning if it forms after an uptrend or at resistance, it hints that buyers are losing power and there’s potential for a bearish reversal. In this case, the upper wick shows a failed attempt by bulls to keep pushing the price up.
Pay close attention when this pattern forms at support or resistance levels as the hammer signals potential exhaustion of the current trend and the start of a new one.
What Does a Hammer Candlestick Look Like
A hammer candlestick has a very unique and identifiable shape on a chart. Here are the key characteristics:
- The real body is small and located at the upper end of the trading range. Color is not important – it can be a red hammer candlestick or a green hammer candlestick.
- There is little to no lower shadow or wick below the real body.
- There is a long lower wick or shadow that extends down from the real body. The lower wick should be at least twice the size of the real body.
- The candlestick opens and closes near the high of the day. The lower shadow shows the intraday low.

Hammer Charts Candlesticks
Essentially, the stocks hammer candlestick looks like an upside down hanging man or hammer, with the head at the top and the handle as a long lower shadow that resembles a “T” shape. This reflects how selling pressure initially pushed the price lower before buyers regained control to close it near the high.
You'll often see the hammer in candlestick chart form within the overall downtrend while hammer candlestick in uptrend is also common.
No matter the market context, the hammer candlestick definition remains the same - a small real body near the top of the trading range and a long lower wick reflecting buying pressure. Learning to recognize all hammer candlestick pattern attributes on the charts is an important price action trading skill.
Different Types of the Hammer Candlestick Pattern
Not all hammer candlesticks are created equal but there are a few varieties that each provide unique trading signals. Here are the main types to know:
Bullish Hammer Candlestick Pattern
The bullish hammer has a small real body near the top of the candlestick range and a long lower wick. The bullish hammer shows buyers overcoming selling pressure during the session and signals potential upside ahead.
It is considered a bullish reversal pattern.
Bearish Hammer Candlestick Pattern
The bearish hammer candlestick has a small real body near the bottom of the candlestick range and a long upper shadow. It shows intraday buying was overcome by selling pressure.
The bearish hammer signals a potential reversal ahead and is viewed as a bearish continuation pattern.
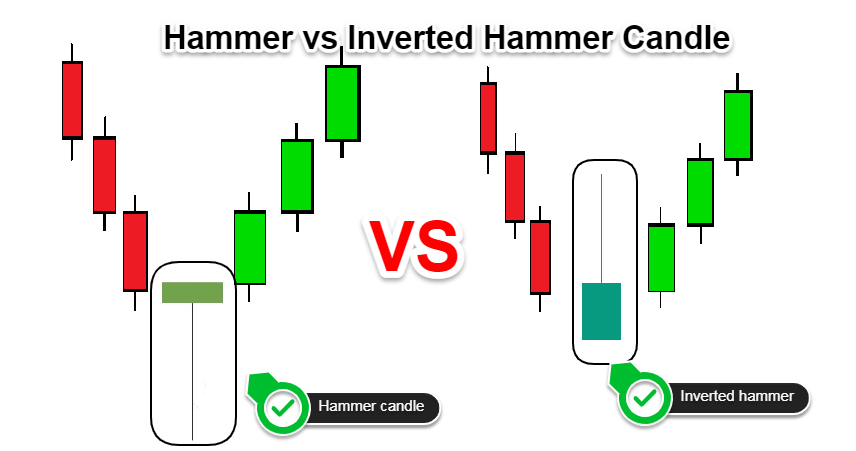
Inverted Hammer Pattern
The inverted hammer pattern looks similar but has a small real body near the bottom of the range. The inverted hammer candlestick meaning is a long lower wick showing buyers stepping in intraday even when sentiment was extremely bearish.
Shooting Star
Don't let the name confuse you, the shooting star is still a type of hammer candlestick but it’s a hammer candlestick in uptrend and signals potential bearishness ahead. It has a small upper body with a long upper wick. The shooting star is considered an inverted hammer shooting star candlestick.
The Pros and Cons of a Hammer Candlestick
Pros of the Hammer Candle:
- Provides early warning of potential trend reversals
- Easy to identify candlestick patterns with a unique and pronounced shape
- Works well for confirmation when combined with other indicators
- Versatile pattern that can be traded in many market conditions
Cons of the Hammer Candle:
- Prone to false signals if used alone without confirmation
- Subjective criteria for lower shadow length makes identification somewhat ambiguous
- Meaning depends on context like prevailing trend and support/resistance
- Stop-loss placement can be challenging due to the long lower wick
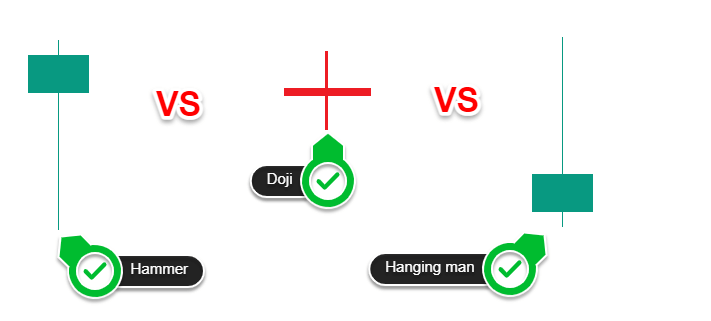
Hammer vs. Doji vs Hanging Man - Know the Differences
The hammer, Doji, and hanging man candlesticks share some common traits but have distinct implications. Here’s how to tell them apart:
- The hammer candlestick definition specifies a small real body near the top of the range and long lower shadow.
- A Doji candlestick pattern has little to no real body at all, indicating indecision with roughly equal open/close.
- The inverted hammer or hanging man looks like an upside down green hammer candlestick at the top of the range.
While the hammer and hanging man both have small bodies and long shadows, the hammer candlestick on top is bullish while the hanging man on top is bearish making them two opposite hammer candlestick.
A hammer or inverted hammer candlestick pattern after an uptrend is likely exhaustion. After a downtrend, they signal potential bottoming.
By understanding the subtle differences between these three major candlestick signals, you’ll be able to make accurate interpretations.
Using Hammer Candles in Technical Analysis
The hammer candlestick is a versatile tool that can be incorporated into most technical trading approaches. Here are some tips for using it effectively:
- Look for hammers to confirm support or resistance levels. The long wick shows buyers defending key zones.
- Combine with momentum oscillators for greater timing precision on reversals. For example, wait for an oversold bounce on indicators like RSI.
- Use hammers after a long downtrend to identify potential long entries or exit short positions.
- Be cautious trading hammers in choppy or range-bound markets where reversal signals are less reliable.
- Require additional confirmation from volume surges to avoid false signals. Volume should pick up on the hammer candle day.
- Consider using stop-buy orders to enter on hammer candle breakouts after a downtrend. This reduces whipsaw risk.
Strategies to Trade the Hammer Candlestick Pattern
Here are two detailed trading strategies using the hammer candlestick pattern:
Trading the Hammer Candlestick with RSI Divergences
One powerful strategy is combining the hammer candle with RSI divergences. This looks for a hammer reversal signal that aligns with RSI making new highs/lows.
For example, after a downtrend, look for a black hammer candlestick to form:
- Then check if RSI is failing to make new lows even as price pushes lower. This RSI bullish divergence suggests waning momentum that could fuel a trend reversal.
- Enter long on a break above the hammer candle's high.
- Place a stop below the low of the bearish candle.
- Target taking partial profits at the next resistance zone and trailing the remainder.

Aligning the hammer candlestick reversal with RSI bullish/bearish divergences improves timing and confirms the pattern. Divergences show momentum is shifting before the price reflects it.
Using Moving Averages to Confirm the Hammer
Another effective tactic is combining the hammer signal with key moving averages (MAs). For example, check if the 50 or 200-day MA lines up with recent swing highs or lows.
If a bullish hammer forms right at the 200-day MA support after a downtrend, this adds confidence the buyers will defend that level. Consider entering long on a close above the hammer candle's high.

Conversely, if a bearish hanging man appears at the 50-day resistance after an uptrend, expect sellers to emerge at that MA hurdle. Consulting moving averages when a hammer pattern forms helps gauge the strength of support or resistance.
When implementing hammer candlestick trading strategies, it's important to use a broker with quality charting and order execution. Pepperstone is a top choice for active traders looking for robust tools and competitive spreads but if you’re a US resident eToro is a better fit.