The Trading Bible Trading Guides ᑕ❶ᑐ Forex Candlesticks: Patterns, Charts, Cheat Sheets
Forex Candlesticks - The Ultimate Guide for Forex Traders
By Stelian Olar, Updated on: Jul 12 2024.
As a new Forex trader, you've likely spent time staring at candlestick charts, wondering what secrets they hold. Those colorful candles contain a wealth of information - if you know how to read them. Mastering common Forex candlestick patterns can help you determine where trends may reverse or continue which can give you an edge when deciding entries and exits.
Have you ever entered a trade, only to have the trend immediately reverse?
Or tried to pick a top or bottom in your favorite currency pair, watching in dismay as the price marched on in the original direction?
We've all been there! Without understanding key Forex candlestick signals, it's easy to misinterpret the foreign exchange market.
The good news is that Japanese candlestick patterns clearly telegraph when currency trends are strengthening or weakening. By learning to recognize candlestick patterns like the Doji, Hammer, Engulfing Pattern, and others, you'll gain valuable insight into future price movements.
Equipped with candlestick knowledge, you can trade with greater confidence, instead of relying on guesswork, you can look to the charts for high-probability trading signals. Mastering price action is a stepping stone to Forex trading success.
Let's explore:
- The most common candlestick patterns Forex,
- What they signify – candlestick chart definition,
- What is the best candlestick pattern in Forex,
- How you can apply them in your own trading,
- And the ultimate Forex candlestick patterns cheat sheet.
What Are Candlesticks in Forex Trading
In technical analysis, Japanese candlesticks provide a clear visual depiction of price action during a specific period of time. The candle shows the open, high, low, and close prices for that time segment. This could be a day, hour, minute, or any time frame you choose.
Specifically:
- The opening price is the first traded price when the candle forms.
- The high price is the highest price reached before the candle closes. It appears at the top of the upper wick (also called a shadow).
- The low price is the lowest traded price, shown by the bottom of the lower wick.
- Finally, the closing price is the last traded price before the candle is completed.
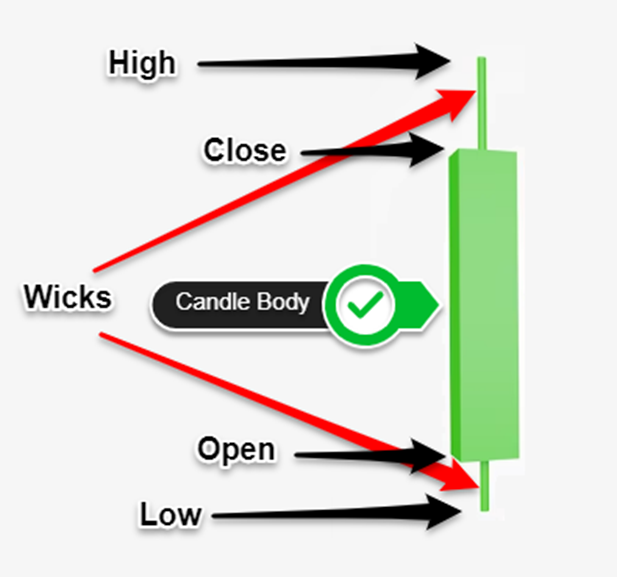
A candlestick has a rectangular "body" flanked by upper and lower "wicks."
The body depicts the open and closing prices, while the wicks represent the high and low prices for the period.
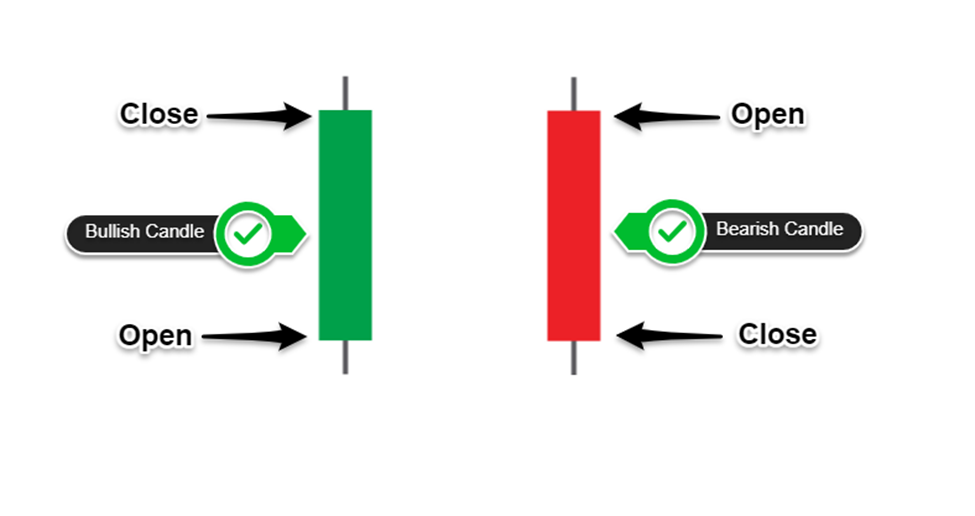
A green (or white) body indicates the close was higher than the open, signaling bullish sentiment – this is known as bullish candles and happens during an uptrend.
Conversely, a red (or black) body conveys a bearish tone, with the close below the open – this is known as bearish candles and happens during a downtrend.
Candlesticks provide a vivid snapshot of the back-and-forth battle between buyers and sellers.
This valuable visual aid helps traders understand who has control and spot key trend turning points in trends, which is why candlesticks Forex mastery is an essential skill for Forex market analysis.
What is a Candlestick Chart
A Forex candlestick chart is a visual representation of the size of price fluctuations in the Forex market. Each candlestick shows the range between the high and low prices reached during the specified time period, revealing the degree of volatility of currency pairs.
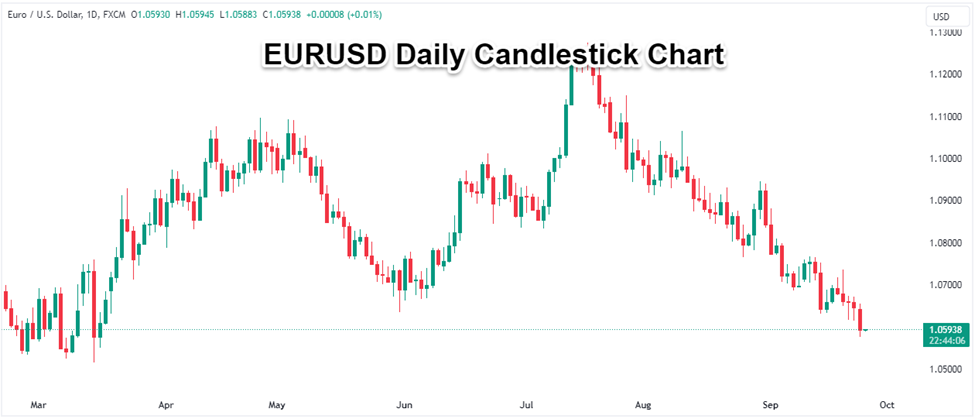
Over time, individual candlesticks form chart patterns that can help Forex traders identify support and resistance levels, trends, reversals, momentum, supply and demand imbalances, indecision, and more.
Learning to read candlestick charts unlocks a world of valuable trading information because the candles reveal market psychology and potential future moves. The visual storytelling nature of candlestick charts enables technical analysis at a glance.
How Do I Read Forex Candlestick Chart
The exact shape Forex all candlestick patterns depends on the relationship between the opening and closing prices, as well as the high and low.
There are many candlestick patterns that provide trading opportunities and insights.
Some patterns demonstrate the balance of power between buying and selling pressure in the market.
For example, a long upper wick shows that buyers initially pushed the price higher before sellers took over and dragged it back down.
Other patterns identify trend continuations or reversals. A series of candlesticks with small bodies and long wicks may signal indecision in the market as buyers and sellers reach a standstill. When a major support or resistance level is breached after such a period of uncertainty, it can indicate the start of a new trend.
By understanding the implications of different candlestick formations, traders can make more informed decisions about when to enter or exit FX trades.
Candlestick Patterns in Forex: Bullish Patterns
Bullish chart patterns are price formations created by one or more individual candles on a Forex chart that signal a buying opportunity and a potential rally.
3 Bullish patterns every Forex trader should know:
- Hammer Forex candlestick pattern
- Bullish engulfing Forex candlestick pattern
- Morning Star Forex candlestick pattern
Other less popular bullish reversal patterns include the inverse hammer, piercing line, bullish inside bar, three white soldiers, bullish marubozu, etc.
Hammer (or Inverse Pin Bar)
The hammer is created by an individual candlestick that gets its name from the hammer-like shape created by a short body and long lower wick. The body can be either bullish or bearish, but green hammers signal a stronger bullish sentiment than red ones.
It appears at the end of a downward trend when a market may be bottoming out.
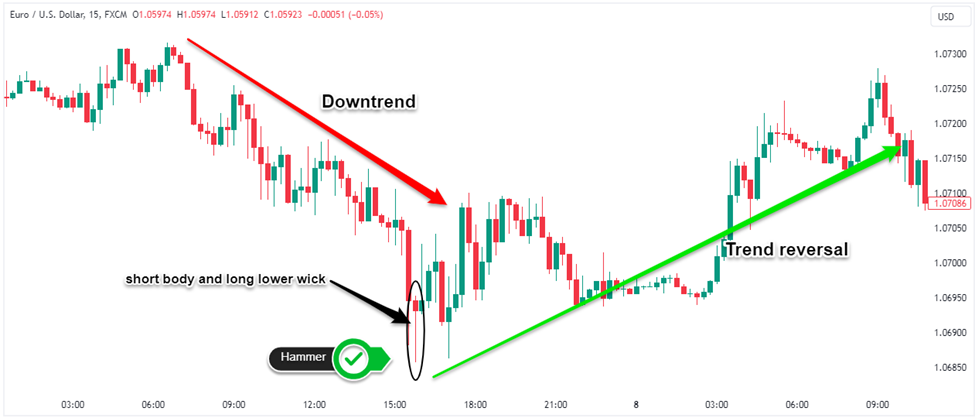
During the period (for example one day on a daily chart), sellers initially pushed the price lower. However, aggressive buying then stepped in to reverse the direction sharply higher. This produced the long lower wick that makes up the "handle" of the hammer.
Though sellers dominated early on, as evidenced by the lower open, buyers overwhelmed them by the close, creating a small body near the top of the range. The strong finish indicates buyers have seized control and upward momentum is building.
Bullish Engulfing
The bullish engulfing pattern is a two-candle formation that signals a potential reversal from bearish to bullish market sentiment.
How to identify it:
The first candle has a small red body, followed by a larger green candle body that completely engulfs the previous red candlestick.
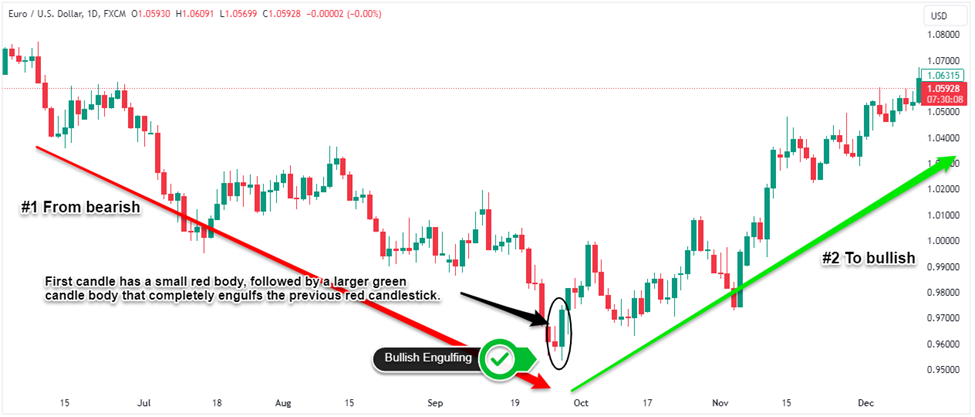
This dynamic engulfing action shows strong bullish momentum has entered the market. The upward trajectory has overtaken the preceding downward path even though the bears controlled the first candle, the bulls have forcefully seized power.
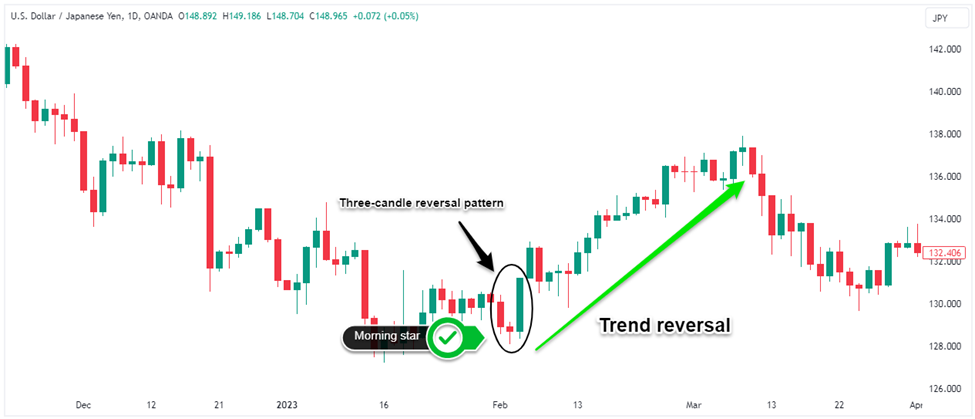
Morning Star
The morning star is a three-candle reversal pattern that pierces through bearish sentiment with a glimmer of optimism that appears in a downtrend and signals the market may be bottoming out:
- The first candle of the morning star is a long red body showing strong control by the bears.
- The market gaps lower on the next candle open, but buying pressure gradually picks up, resulting in a small body candlestick. This middle "star" body is where the bulls have started battling back.
- On the third candle, upward momentum continues with another gap higher open. The buying pressure overwhelms selling pressure, culminating in a long green body that eclipses the first red candle's low.
Candlestick Patterns in Forex: Bearish Patterns
Bearish chart patterns are price formations created by one or more individual candles on a Forex chart that signal a selling opportunity and a potential drop in the currency pair price.
3 Bearish patterns every Forex trader should know:
- Hanging man candlestick Forex pattern
- Shooting star candlestick Forex pattern
- Bearish engulfing candlestick Forex pattern
Other less popular bearish chart patterns include the three black crows, dark cloud cover, bearish marubozu, etc.
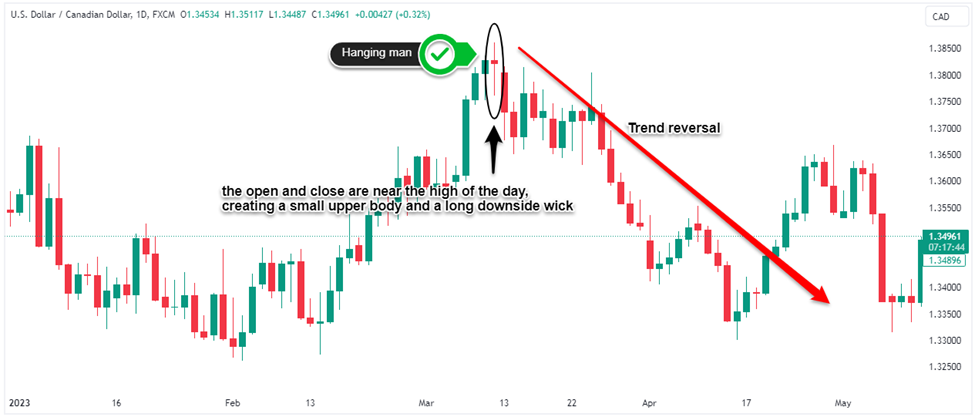
Hanging Man (or Pin Bar)
The hanging man formation gets its name from its shape - a small body dangling below a long lower wick. This bearish candlestick Forex pattern appears at the peak of an uptrend as a warning that selling momentum is building.
On a hanging man candle, the open and close are near the high of the day, creating a small upper body.
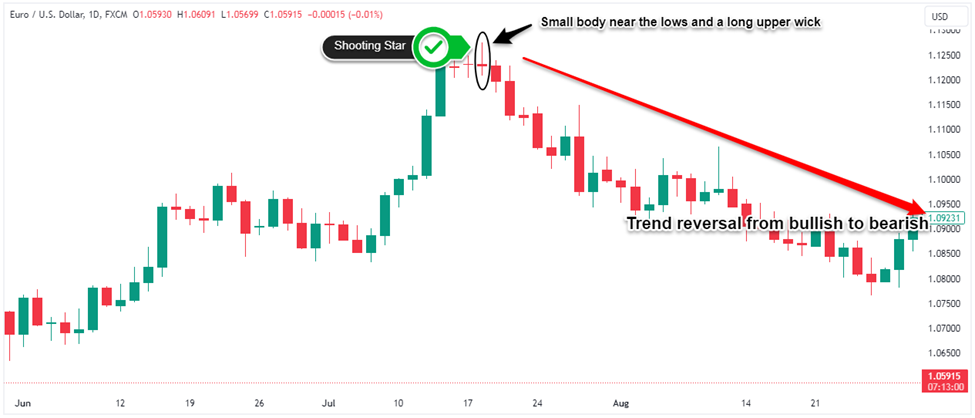
Shooting Star
The shooting star consists of a small body near the lows and a long upper wick that is at least double the candle's body price range warns Forex traders of a potential trend reversal, but forms at market tops.
The long upper wick demonstrates that buyers initially pushed the price higher. However, aggressive selling quickly stepped in to reverse the direction and close the candle near the open.
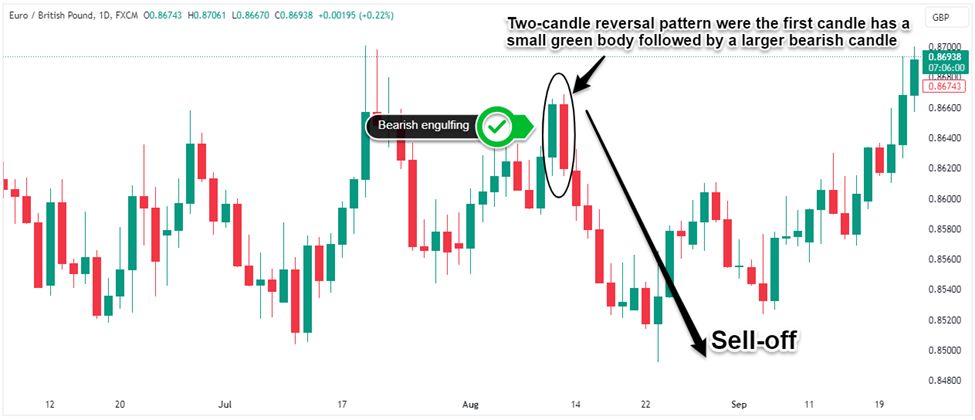
Bearish Engulfing
The bearish engulfing pattern is a two-candle reversal pattern where the first candle has a small green body followed by a larger bearish candle that totally engulfs the first candle.
The deeper the red body dips below the first candle, the more convincing the emerging downtrend.
Continuation Candlestick Patterns
Continuation patterns reflect consolidation – they show the market is taking a breather after a significant price swing, with neither buyers nor sellers able to gain control.
3 continuation patterns every Forex trader should know:
- Doji
- Spinning top
- Bullish and bearish flags
Other less popular continuation chart patterns include the falling three methods, rising three methods, pennants, triangles, etc.
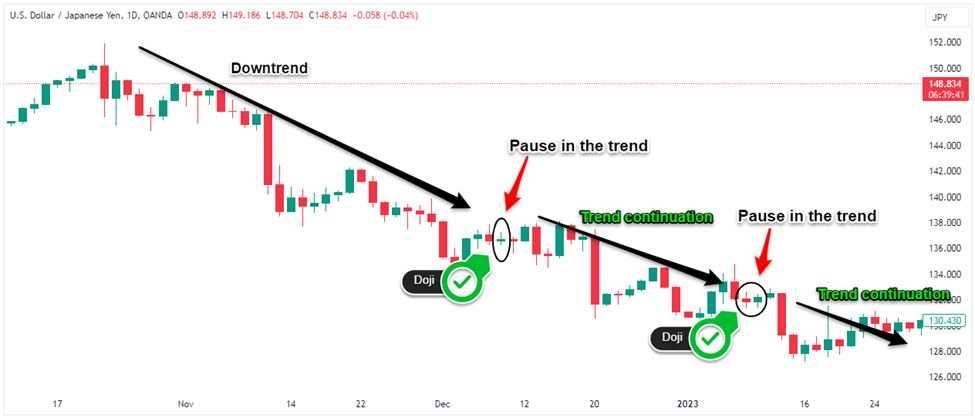
Doji
Dojis are a single candle price formation that highlights market indecision because the open and close are nearly equal, creating a cross-like candle with no real body.
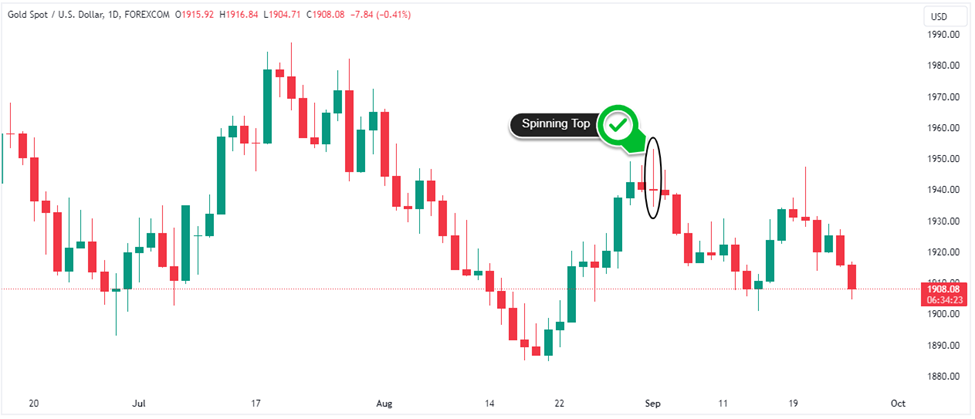
Spinning Top
These have small bodies with upper and lower wicks of similar length, indicating a tug-of-war between bulls and bears.
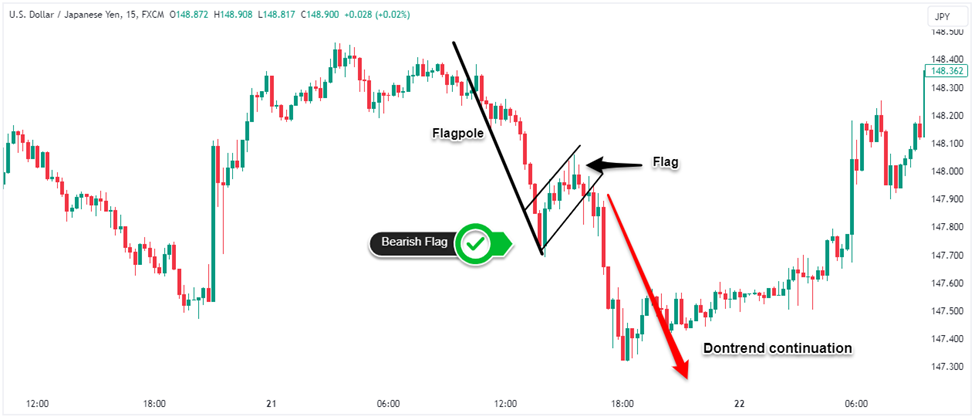
Flags
These compact patterns with sloping "flagpole" bodies show the market catching its breath within the main trend.
How To Trade Forex Using Candlestick Charts
Candlestick charts provide a visually intuitive way to identify potential trading opportunities based on recurring price action patterns. Here are some tips for using them effectively:
- Scan charts to spot high-probability candlestick signals.
- Look for confirmation from other indicators or candlesticks before entering trades. For example, a hammer followed by a bullish engulfing pattern provides greater confidence.
- Use analysis techniques like trendlines, chart patterns, and support/resistance with candlestick signals.
- Practice entering and exiting demo trades based on candlestick signals until you can recognize profitable setups
- Use stop losses, limit total position size, and avoid overtrading.
- Not every pattern works perfectly, so use discretion and adaptability when prices move against you.
What is the Best Candlestick Pattern in Forex for Traders
There is no single "best" or "most accurate" candlestick pattern, as they should be viewed as indicators of potential market psychology shifts.
The evening and morning star reversal patterns are time-tested for spotting trend changes at market bottoms and tops. Hammers, shooting stars, engulfing, and harami patterns also tend to provide high-probability setups.
Traders typically look for confirmation through indicators or other candlesticks before acting on these patterns. No pattern offers guarantees, but combining analysis with risk management principles can improve the odds of successful trades.
Download Free Forex Candlestick Patterns Cheat Sheet
Forex trading with the below candlestick patterns cheat sheet to spot frequent chart formations that suggest potential trading opportunities:
Pattern |
Description |
Signal |
|
Hammer |
Long lower wick, small body at top of range |
Bullish reversal |
|
Morning Star |
Long red candle, short middle "star", long green candle |
Bullish reversal |
|
Piercing Pattern |
Down candle followed by an up candle that pierces the midpoint |
Bullish reversal |
|
Bullish Engulfing |
Small red candle engulfed by large green candle |
Bullish reversal |
|
Hanging Man |
Long lower wick, small body near top of range |
Bearish reversal |
|
Long green candle, short middle "star", long red candle |
Bearish reversal |
|
|
Dark Cloud Cover |
Up candle followed by a down candle that crosses the midpoint |
Bearish reversal |
|
Bearish Engulfing |
Small green candle engulfed by a large red candle |
Bearish reversal |
|
Rising Three Methods |
Short pause in uptrend |
Continuation |
|
Falling Three Methods |
Short pause in downtrend |
Continuation |
|
Flags & Pennants |
Consolidation within trend channel |
Continuation |