The Trading Bible Blog ᑕ❶ᑐ Hanging Man Candlestick: Pattern, Meaning, and Examples
Hanging Man Candlestick Pattern Explained
By Stelian Olar, Updated on: Jul 12 2024.
Have you ever noticed a candlestick on a chart that looks like a little man hanging from the gallows? Morbid, I know. But that’s exactly what a hanging man candlestick resembles in the financial markets.
As an active trader looking to boost your profits, you’ve probably encountered many different candlestick patterns. But the candlestick hanging man tends to grab attention with its unique shape.
If you don’t know how to identify it or understand the hanging man candlestick meaning, you could be missing out on key trading signals.
In this article, we’ll explore:
- Everything you need to know about the hanging man candlestick pattern.
- You’ll learn what a hanging man looks like.
- What hanging man pattern candlestick indicates about market sentiment,
- And how to leverage the hanging dead man candlestick in your own trading strategy.
Understanding candlestick patterns like the hanging man candle is crucial for timing entries and exits. One simple pattern can speak volumes about where the market may move next. My goal is to decode the mystery of the hanging man so you can spot it easily and use it to make smarter trades.
So let’s get started dissecting what is a hanging man candlestick - the ominous hanging man. With the right know-how, it could help hang a “profit” sign on your next trade.
What Is the Hanging Man Candlestick Pattern
In technical analysis, the hanging man patterns are a single candlestick patterns that forms primarily at the top of an uptrend. It has a distinctive shape in Japanese candlestick charts that resembles - you guessed it - a hanging man candlestick. Specifically, the hanging man candle has:
- A long lower shadow or "wick"
- A small real body at the top of the candlestick range
- Little to no upper shadow or wick
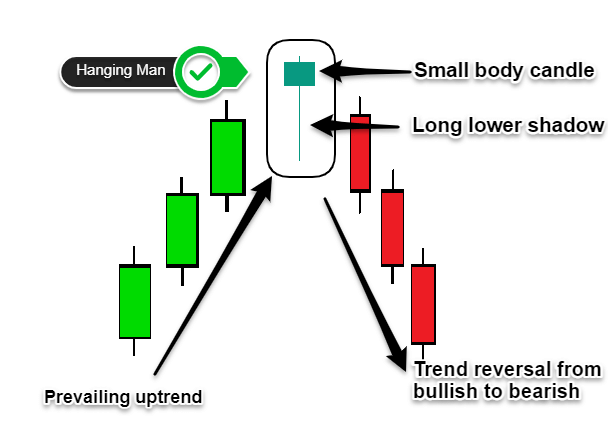
Essentially, the hanging man candlestick chart pattern signals potential trend reversals of an uptrend. It indicates buyers may be losing control and sellers are starting to enter the market.
Spotting this ominous candlestick pattern forms on your hanging man candlestick chart can tip you off that upside momentum is waning. Heeding the hanging man candlestick meaning can help you time exits or even reversal trades.
Now that we know what does a hanging man candlestick mean, let's discuss what it indicates about market sentiment.
What Does the Hanging Man Candlestick Indicate
As mentioned earlier, the hanging man is considered a bearish reversal pattern. In essence, the hanging man candlestick chart shows a battle between eager sellers and increasingly weak buyers. Sellers were able to drive prices lower intraday but lacked the momentum to sustain the down move.
Note* Two hanging man candlesticks in a row or a double hanging man candlestick pattern show even more potential exhaustion after extended moves.
Long Wick Explanation
The long lower shadow represents aggressive selling pressure during the trading period. This pushed the price substantially lower, only to be rejected back up by buyers to close near the open. The lack of an upper wick shows sellers were still largely in control by the close.
The presence of selling pressure indicates bears may be gaining an edge over bulls and the upside drive could be running out of steam.
Traders will want to watch for confirmation on the next candlestick or two after the hanging man appears. Continuation of the downtrend provides validation that a reversal may be underway.
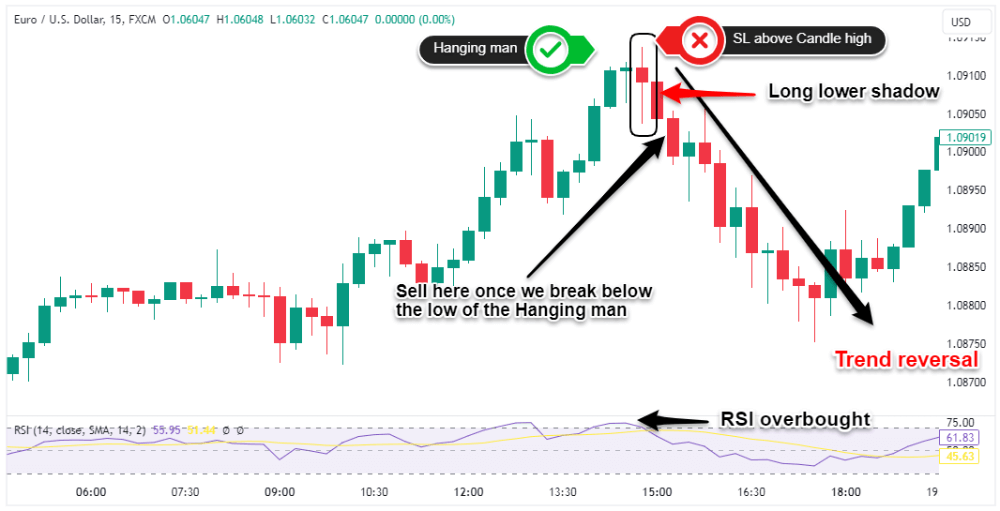
Let's look at some real hanging man candlestick examples now so you can recognize them instantly on a chart showing candlestick patterns hanging man.
How Accurate Is Hanging Man Pattern
Like most candlestick formations, the hanging man is not a guarantee that a downturn will occur because no single indicator can precisely predict what will happen next in the markets.
However, the hanging man candlestick does have a high statistical accuracy when it forms in the proper context. So, it differs significantly depending on whether the hanging man forms in a downtrend or uptrend.
Hanging man in a downtrend
The accuracy is low, around 30-40%. Since the overall trend is down, the hanging man is often a false signal that quickly fails.
Hanging man in an uptrend
Studies have shown that when we find the hanging man candlestick at top of an uptrend, it correctly forecasts reversals around 70-80% of the time. The best accuracy comes when a hanging man appears after an established uptrend, indicating upside exhaustion that often leads to a reversal.
Types of Hanging Man Candles
There are a few varieties of hanging man candles to be aware of based on the price action and where they form:
- Inverted Hanging Man Candlestick Pattern - This forms after a downtrend rather than uptrend and has a long upper shadow and small body near the low. Reliability is low due to the existing bearishness.
- Doji Hanging Man Candlestick - The real body is extremely small to nonexistent, creating a doji-like appearance showing indecision and potential topping.
- Dragonfly Doji Hanging Man - A doji with a very long lower shadow and no upper shadow. This type of hanging man doji candlestick signals potential upside exhaustion.
- Gravestone Doji Hanging Man - A doji with a long upper shadow and no lower shadow. Warns of weakening momentum.
The most reliable is the classic hanging man with a small real body and long lower shadow after an uptrend. But being aware of variations helps identify nuances in price action.
The Difference Between Hanging Man Pattern, Shooting Stars, and Hammers
There are a few candlestick patterns that look similar to the bullish hanging man candlestick at first glance. Let's clarify the key differences between the hanging man candlestick and these two common formations:
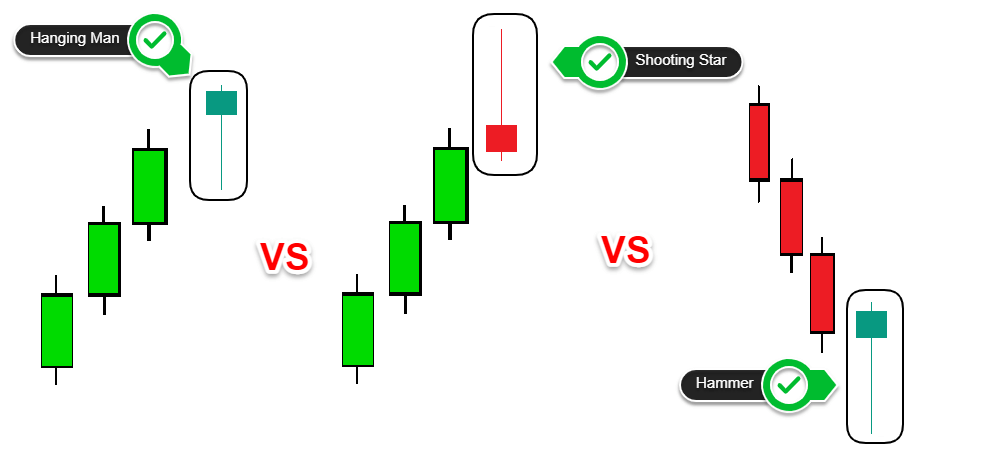
Shooting Star Candlestick
- The shooting star forms after an uptrend like the hanging man candlestick
- Has a long wick to the upside and small real body like the hanging man candlestick
- Key difference: Shooting stars have a higher closing price relative to the open, hanging man candlestick closes near open
Hammer Candlestick
- Hammer candlesticks forms after a downtrend rather than uptrend
- Long lower shadow with small real body is similar to hanging man candlestick
- Difference: Hammers close at the top of the range, hanging man candlestick near the open
So in essence:
Shooting stars are the bearish equivalent of the candlestick pattern hanging man. At the same time, hammers are the bullish version, though less reliable in a downtrend – view them as the opposite of hanging man candlestick.
Hanging Man vs. Shooting Star Candlestick
Let's do a deeper dive comparing the hanging man and shooting star candlestick patterns. Despite their visual similarities, there are some key nuances:
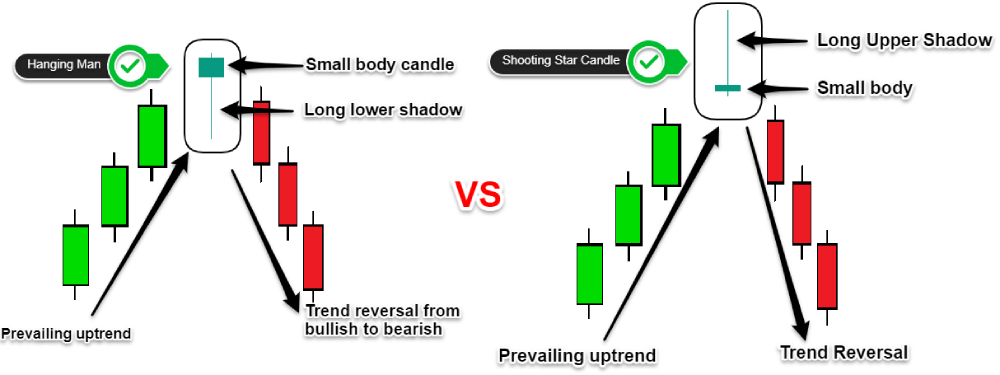
Formation and Significance
Both form after uptrends, but the bearish hanging man candlestick is less powerful when compared to the shooting stars which tend to be a stronger reversal signal, closing much higher and indicating buyers couldn't sustain gains.
Candle Details
The shooting star has a small body near the low of the candle, while the hanging man's is near the top. Hanging men don't need to be bearish candles, but shooting stars are always bearish colored. A green hanging man candlestick still signals weakness among buyers.
Reliability and Trading Tactics
Shooting stars tend to be more reliable with confirmation. For either pattern, place stop losses above the high and sell at closing below the lows to signal reversals.
The Difference Between Hammer and Hanging Man Candlestick
The candlestick hammer and hanging man also bear a striking resemblance. Let's break down the key difference between hammer and hanging man candlestick:

Context
Hammers form after downtrends while the hanging men after uptrends. The hammer candlestick signals potential bullish reversal, hanging man a bearish reversal.
Candle Details
Bot hammers and bullish hanging man candlestick pattern bodies are at the top of the candle and a long lower wick. An inverted hammer candlestick pattern is the same as an upside down hanging man candlestick and is a hybrid.
Signal
The strong hammer close indicates buyers stepping in, making it a more reliable bullish reversal signal than the hanging man candlestick. Further validation on the following candles is required to confirm the potential reversal for both the hanging man and the hammer.
In summary:
- Hanging Man: A bearish reversal pattern after an uptrend.
- Hammer: A bullish reversal pattern after a downtrend.
Pepperstone's award-winning platform (eToro for US residents) provides the tools and competitive pricing to execute what you've learned. Open your account here to begin analyzing charts and identifying hanging man patterns in real-time.