The Trading Bible Blog ᑕ❶ᑐ Double Top Pattern in Trading - Meaning, Types, Charts
Double Top Chart Pattern - Trader's Guide
By Stelian Olar, Updated on: Jul 12 2024.
The double top pattern is an important chart pattern for traders to recognize. This reversal pattern forms when a stock price hits the same peak level twice before declining.
As an investor or trader, being able to identify chart patterns like the double top can give you an edge in timing your trades.
But what is a double top in stocks and why does it matter?
In this article, we’ll explore the:
- Double top pattern meaning,
- The psychology behind it,
- And how to trade it.
Whether you're a novice learning to read stock charts for the first time or a seasoned trader looking to refine your pattern recognition skills, this guide will help you understand and use the double top chart pattern to your advantage.
Trading can feel like an emotional rollercoaster at times. One day your stock is trending up, the next it's taking a tumble. Making sense of the constant ups and downs is no easy feat but reading the clues in price movement and stock chart patterns is essential to better anticipate potential changes in trend.
The double top reversal pattern is one important signal to watch for but it takes practice to spot them early which can make a big difference in the success of your trades.
As we walk through real chart examples and the psychology behind the stock double top pattern, you’ll gain valuable skills for identifying double tops and using them to your advantage.
So let's dive in and shed some light on this key reversal pattern!
What is a Double Top Pattern
In technical analysis double top is a bearish reversal chart pattern that forms after an uptrend. It is created when a stock hits the same high price level twice with a moderate decline between the two peaks. This occurs because the stock meets resistance level when it attempts to break above a certain price level.
The two peaks create a distinctive "M" shape on the chart (see the double top chart below). Double tops indicate a potential trend reversal from an uptrend to a downtrend.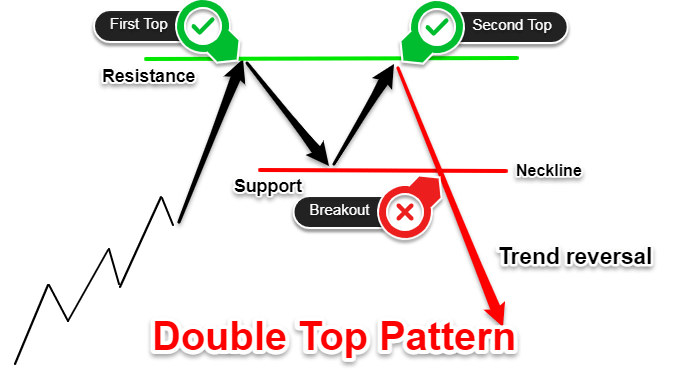
Specifically, a double top candlestick pattern forms when a stock:
- Rises and hits a new high price (double top stock reaches resistance line)
- Declines slightly and then rallies back to hit that same high again (double top in stocks meets resistance again)
- Falls below the valley/trough between the two peaks (breakdown below support level)
Double tops are common reversal patterns to watch for in technical analysis.
Traders often use them to identify potential long exits or short entry opportunities when they appear after an extended advance. The pattern reflects hesitancy among buyers and potential distribution.
Double Top and Double Bottom
The double top is often discussed alongside its opposite pattern - the double bottom. While bearish chart patterns double top signals a potential reversal from an uptrend to a downtrend, the double bottoms are bullish patterns that hints at a change from a downtrend to an uptrend.
Being able to recognize both the double top and double bottom chart patterns is important for traders looking to capitalize on shifts in market trends. While these two "opposite" chart patterns mirror each other, the double top demonstrates weakness as buyers lose steam, whereas the bottom patterns show renewed buyer strength.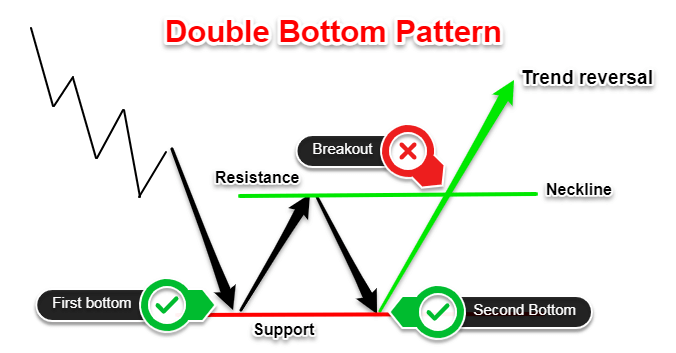
Now that we know what a stock double top is, let’s see what does a double top indicate.
See below…
What Does a Double Top Indicate
The double top reversal chart pattern is an indication that momentum is slowing and demand is weakening at a key resistance level. Essentially, it signals that buyers could not push the stock price above the same higher high, reflecting a potential shift in control from bulls to bears.
The chart double top shows that there is significant overhead supply that prevents the stock from breaking out above the prior peak. Sellers have overpowered the buyers twice at the same price. This suggests emerging downside momentum in the stock.
Overall, the completion of these reversal chart patterns is a strong technical signal for double top stocks. It indicates that the uptrend is stalled and warns of a potential trend reversal from an advance to a decline. Traders watch for a breakdown below support to confirm the pattern.
How to Identify a Double Top Formation on a Chart
Spotting double tops Forex as a beginner trader takes patience and practice. But learning this pattern can really pay off!
Here are some tips for new traders on finding double top Forex on candlestick charts:
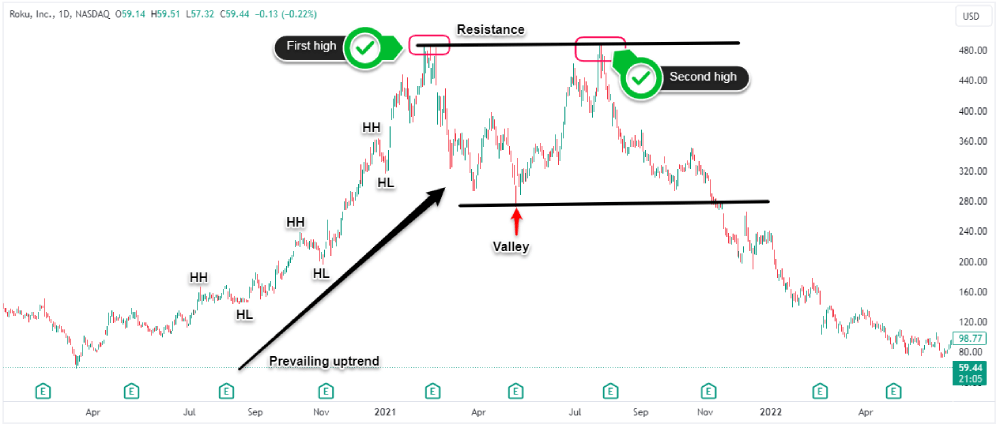
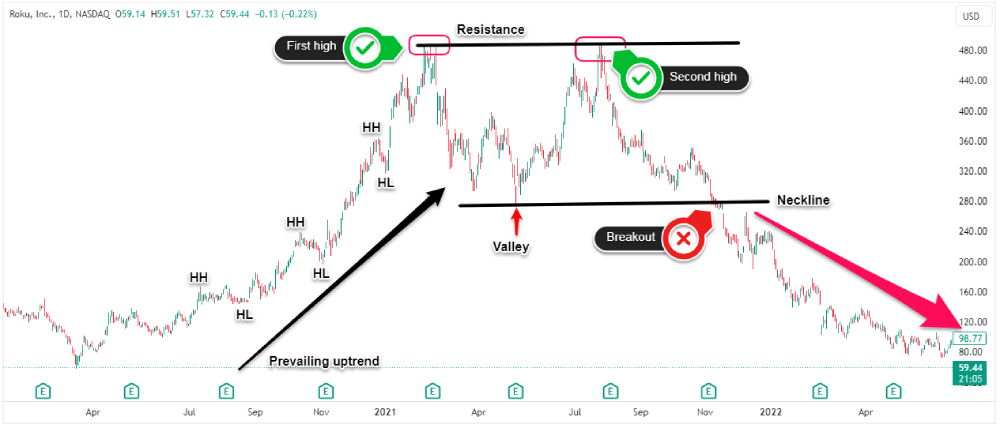
#1 Prevailing Uptrend
First, look for a clear uptrend. Prices should be rising over time and making higher highs and higher lows. This uptrend is key for then reversing into a double top downturn.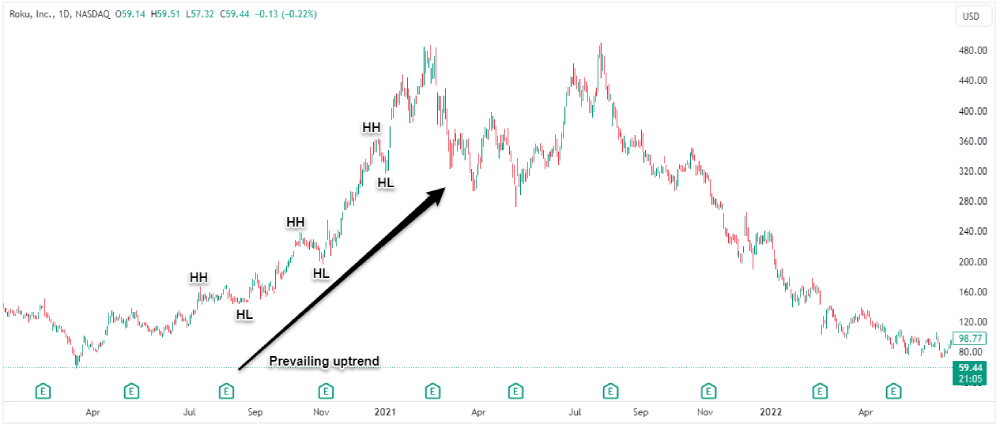
#2 Pinpoint the first High
Next, watch for the first peak. This is where the uptrend hits a high point and starts turning downward. Mark this first peak price.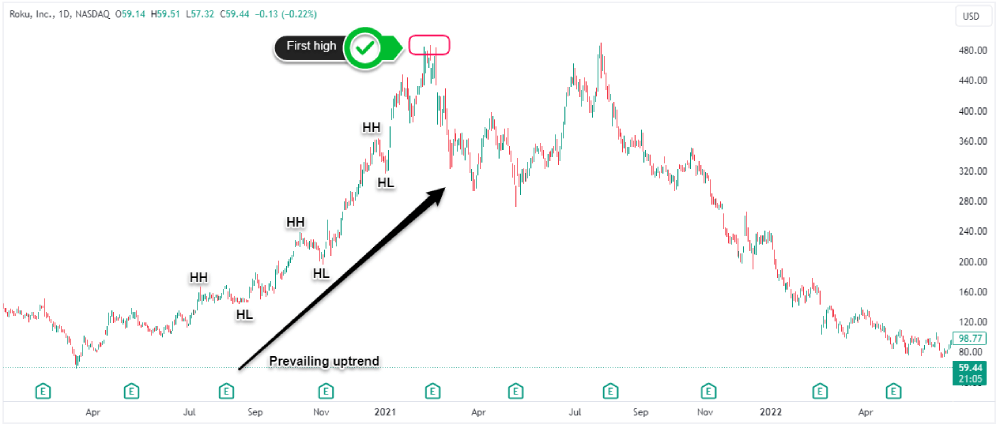
#3 Find the first Valley (swing low)
When prices drop, they'll form a trough or low point which is the valley between the two tops. Make a note of this trough.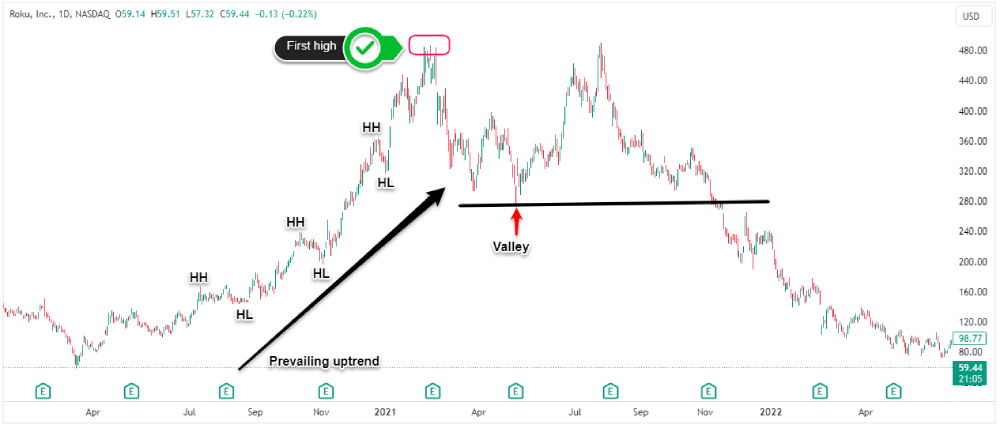
#4 Pinpoint the second Top
Then we want prices to rally again, trying for a second peak which may get close to that first high but won't exceed it.
#5 Draw the Neckline
If prices then head down again and break below that trough, the double top pattern is likely forming! Connect the two troughs using trend lines to make the neckline.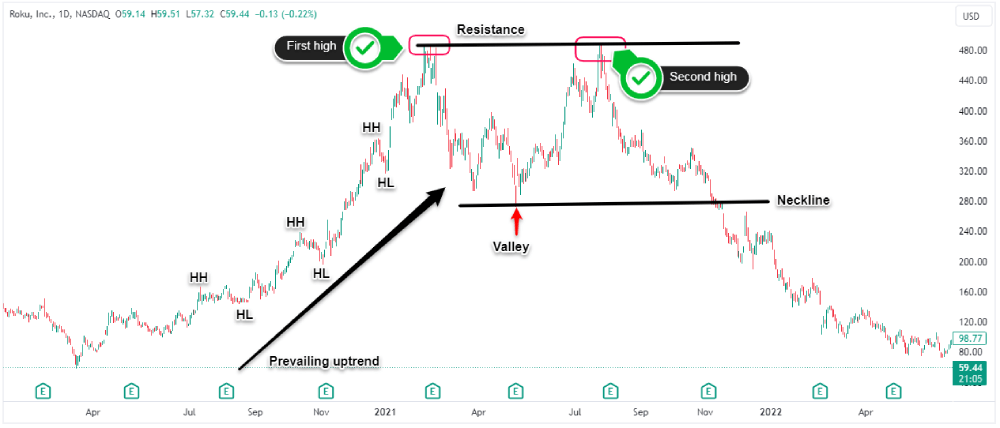
#6 Wait for confirmation
Finally, wait for a break and close below the neckline to confirm the reversal and signal to sell. This double top chart pattern breakout signals the potential start of a downtrend.
With focus and reviewing many chart examples, new traders can master spotting this formation. Identifying double top pattern Forex takes work but it's a key skill in detecting trend changes early!
How to Trade the Double Top Pattern
When trading double top patterns, it's crucial to wait for the breakdown of support level (the neckline) before entering short trades. The initial peaks and pullback are warning signs, but the pattern only completes on the support line break.
Once support is broken, traders can confirm the double top trading on the sell side with”
- A protective stop loss above the recent swing high.
- And a minimum target that is the height of the pattern subtracted from the breakdown point but, targets can extend much further in strong trends.
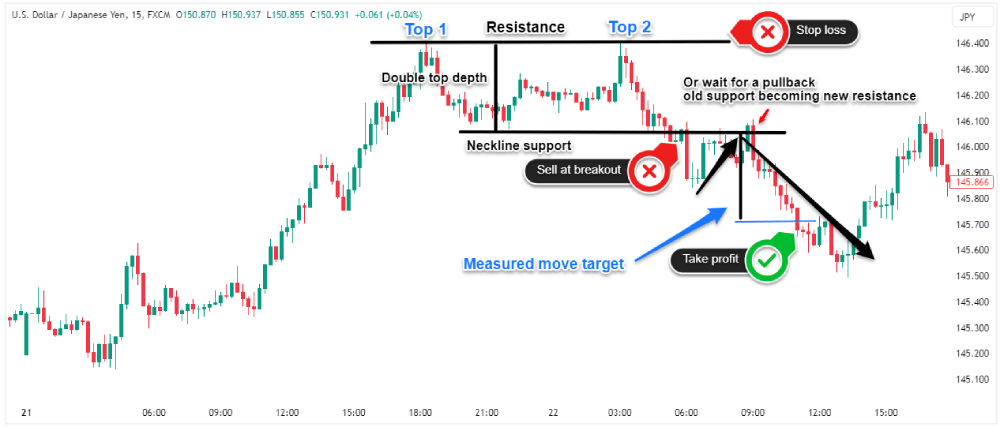
It's generally wise to wait for a pullback or retest of broken support before entering shorts. This helps verify the new resistance level and suggests exhausted buyers. The stop loss can then be placed above the failed support.
Patience is key when trading double tops so make sure you wait for clear pattern confirmation before trading. The double top trade can offer great reward if timed properly. Always use stops in case the pattern fails and plan profit targets based on the height of the formation.
Common Mistakes When Trading Double Tops
When doing double top technical analysis traders should avoid some common errors like:
- One mistake is trading the double top chart patterns too early before confirmation. The initial peaks are warning signs but the setup isn't complete until support breaks down so entering shorts prematurely can lead to being stopped out.
- Another mistake is placing stops too close or without allowing some wiggle room. Markets rarely break down in a straight line which is why giving the trade room to fluctuate results in fewer premature stop-outs.
- Setting unreasonable profit targets is also an error. While targets based on the pattern's height are sensible, extending targets too far can lead to missed gains. Reasonable targets are key.
- Finally, neglecting sound risk management practices like stop losses can turn a promising double top trade into a disaster.
Avoiding these common errors allows traders to maximize their probability of success when trading double top patterns.
Just like learning the alphabet before sentences, nailing down these foundations will provide the basic building blocks you need to capitalize on more advanced chart analysis like the 4 top chart patterns: descending triangle, symmetrical triangle, wedge chart pattern, and falling wedge.
Now that you understand how to identify and trade the double top pattern, you may be ready to start applying these skills in a live trading account. If you're looking for regulated and trusted brokers that provide access to global markets, consider checking out Pepperstone and eToro – for US residents.