The Trading Bible Blog ᑕ❶ᑐ Reversal Candlestick Patterns: Bearish and Bullish Reversal Candles
Reversal Candlestick Patterns - A Beginner’s Guide for Traders
By Stelian Olar, Updated on: Jul 12 2024.
Have you ever felt frustrated watching the market reverse right after you enter a trade?
I've been there too.
Nothing stings more than seeing your open profit get wiped out in minutes. If this sounds familiar, learning reversal candlestick patterns could be a game-changer for your trading.
In this guide, we'll explore the most powerful candlestick reversal patterns that signal potential trend reversions. Whether you trade stocks, Forex, or crypto, understanding bullish and bearish reversal candlestick patterns can help you adeptly navigate price action.
By the end, you'll have a solid framework for identifying key reversal signals on your charts. Imagine having the conviction to hold your winners longer or exit your losers quicker.
Now that's a trading strategy worth learning!
Reversal candlesticks won't make you a profitable trader overnight but combining them with risk management and your own trading plan can drastically improve your win rate.
Are you ready to learn how to spot tops and bottoms more accurately?
Let's dive in!
What Is a Reversal Candlestick Pattern
A reversal candlestick pattern is a formation on a candlestick chart that signals a potential change in the direction of a trend. Unlike candlesticks that continue the current trend, reversals imply that buyers or sellers are losing control and the price may start moving the opposite way.
All reversal candlestick patterns provide traders with early clues that the momentum is shifting, before the trend fully reverses.
That’s why learning to quickly recognize them can help you adapt to changing market conditions.
Candlestick charting has been used for centuries by traders performing technical analysis. The shapes, sizes, and colors of the candlesticks reflect the battle between buying and selling pressure during each period. Reversal patterns emerge when this battle results in a potential power shift.
Mastering the most common reversal candlestick patterns takes practice but being able to spot them in real-time will make you a savvier price action trader.
Let's explore some of the best candlestick reversal patterns next.
Differences Between Bullish and Bearish Reversal Candlestick Patterns
When interpreting candlesticks, it's crucial to understand the distinctions between bullish and bearish reversals. The shape, color, and position of the open and close prices indicate which direction the pattern is predicting:
- Bullish candlestick reversal patterns contain the open price at the low of the period and close near the high. This shows buying pressure stepped in and reversed the downtrend. Some examples of bullish candles are the Hammer, Inverted Hammer, and Bullish Engulfing patterns.
- Bearish reversal candlestick patterns instead open near the high and close at the low. The selling pressure was strong enough to reverse the uptrend. The Shooting Star, Hanging Man pattern, and Bearish Engulfing are common bearish candles.
Remember, the trend preceding the reversal dictates its potential:
- A bullish reversal holds more weight in a downtrend.
- And a bearish reversal has higher probability reversing an uptrend.
Context is key!
Now that you know what makes candlesticks bullish or bearish, let's examine some of the most reliable reversal patterns to trade. Being able to quickly spot these candlestick patterns on a chart can help you profit from short-term changes in market sentiment.
Key Bullish Reversal Candlesticks
When trading in a downtrend, keep an eye out for these potent bullish reversal candlestick patterns signaling potential bottoms in any market.
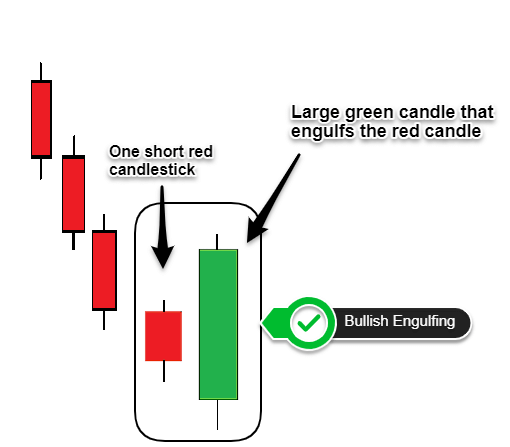
Bullish Engulfing Pattern
This strong bottom reversal candlestick forms when a green candlestick completely engulfs the previous day candlestick which is often a red candlestick, implying buyers have overwhelmed sellers. The bullish engulfing pattern indicates the downtrend may be ending.
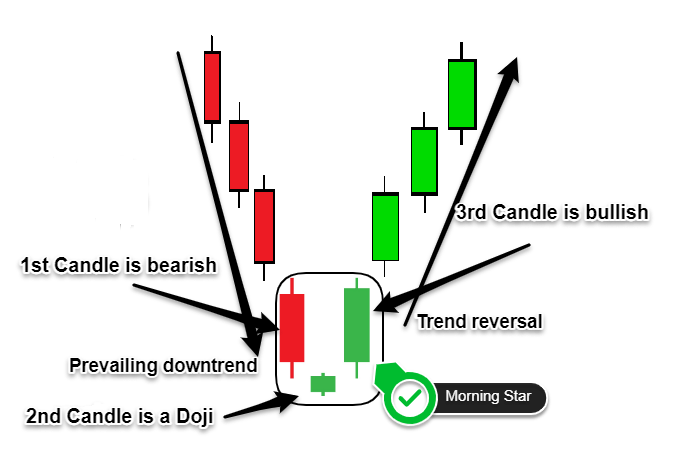
Morning Doji Star
The morning Doji star contains a Doji candlestick sandwiched between one bearish candle and a third bullish candle, creating a star shape. This shows indecision followed by bullish confirmation.
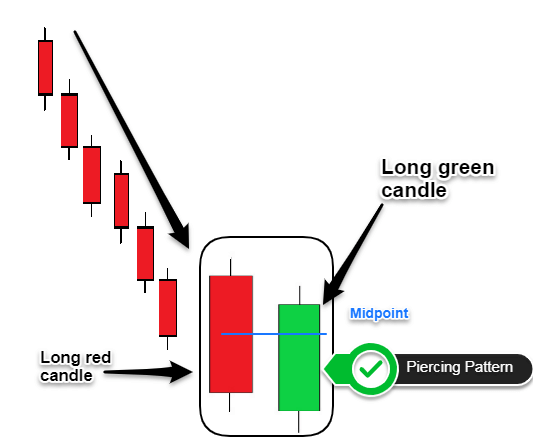
Piercing Pattern
In a piercing pattern, the open and close of a green candlestick "pierce" into the body of the preceding red candlestick and closing above the midpoint of the previous candles’ price range. It shows buyers are wresting control from sellers.
Three White Soldiers
As the name suggests the three white soldiers is a 3 candlestick reversal patterns formed by a series of three long green candlesticks with consecutively higher closes signals strong bullish momentum that often coincides with reversal points after prolonged selloffs.

There are many other reliable downtrend reversal candlestick patterns. Mastering even one or two can help you trade downtrend breakouts profitably.
Key Bearish Reversal Candlesticks
When trading in an uptrend, be on the lookout for these powerful bearish reversal candlestick patterns that may signal upcoming tops:
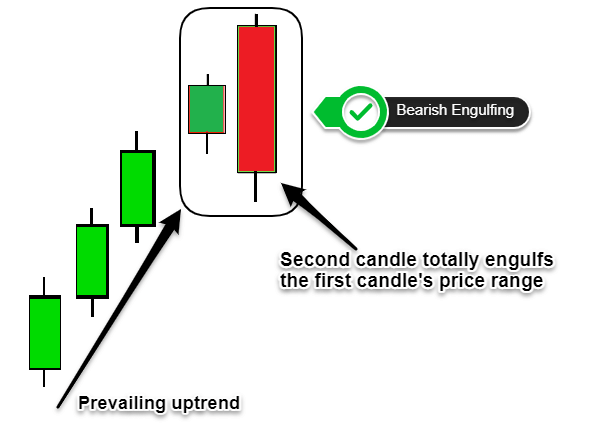
Bearish Engulfing Pattern
This pattern formed when a large red candlestick engulfs the previous green candle, showing strong selling pressure overwhelming buying pressure. This bearish reversal pattern implies the uptrend may be ending.
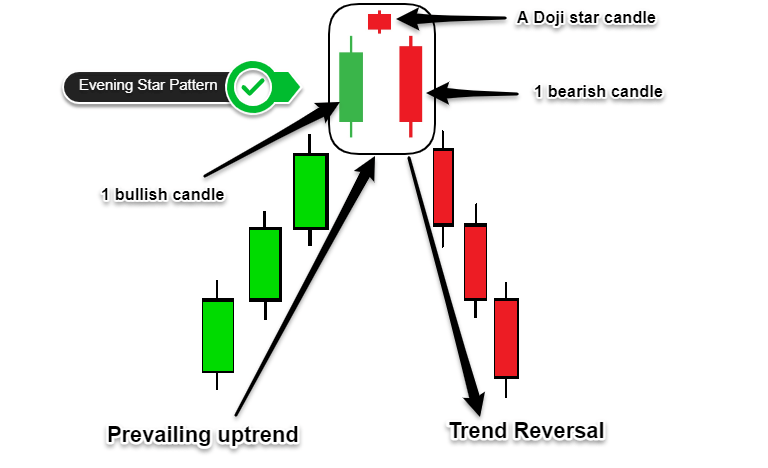
Evening Doji Star
This bearish reversal candlestick is formed when a doji candle is sandwiched between two larger candles – one bullish candle and a bearish candle. The indecision of the reversal doji candlestick followed by the larger bearish candle is what creates the confirmation of a bearish trend reversal.
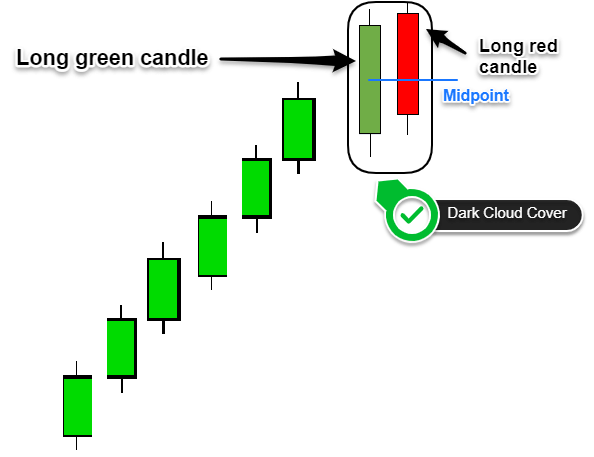
Dark Cloud Cover
The dark cloud cover is a bearish reversal candlestick pattern formed by two candles, where the open of the second candle is above the close of the previous candles and the close is below the midpoint of the first red candlestick. This shows the bears taking control from bulls.
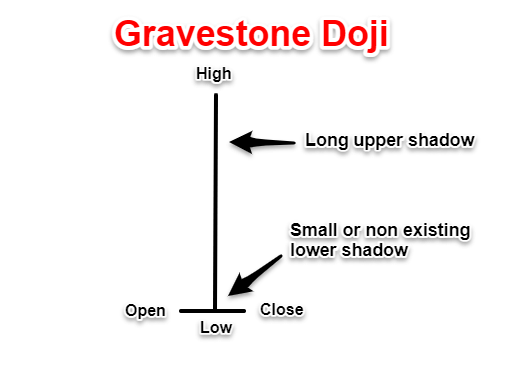
Gravestone Doji
The gravestone Doji is a single candlestick opens and closes at the low, with a long upper wick showing and no body candle that rejected higher prices.
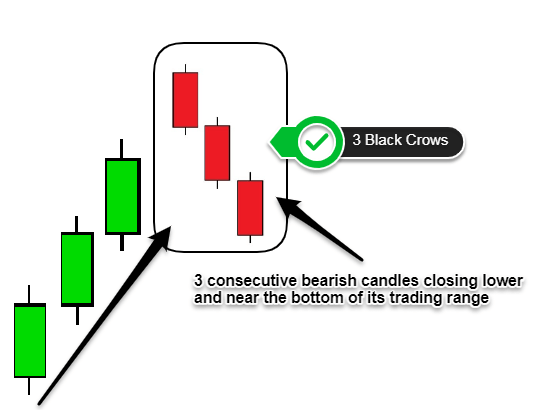
Three Black Crows
Three consecutive long red candlesticks with progressively lower opens and closes indicate strong bearish momentum. Besides being a powerful bearish reversal candlestick, the three black crows pattern is also a strong bearish continuation pattern.
There are many other useful candlestick bearish reversal patterns and just to name two candlestick reversal patterns like the Harami pattern and Abandoned Baby, which can also help you profit from trading trend reversals.
What Is the Strongest Reversal Candlestick Pattern
With dozens of candlesticks reversal patterns to choose from, you may be wondering - which one is the most reliable? While there is no universally "best" pattern, there are a few that tend to have higher probability of reversing the trend.
The Bullish and Bearish Engulfing patterns can be quite strong, as they show a complete change in market sentiment between the two candlesticks. The larger the engulfing candlestick compared to the previous one, the more powerful the reversal signal.
Morning and Evening Doji Star patterns also tend to be high probability reversal candlestick patterns.
No single candlestick should be traded mechanically in isolation, but combining the most effective reversal patterns with other confluences like volume, support/resistance, or momentum oscillators can create robust trading signals.
Are Reversal Candlestick Patterns Reliable?
According to a study by Thomas Bulkowski, the bullish engulfing pattern succeeds about 53% of the time while the bearish engulfing fares slightly better at 61%.
Not a coin toss, but not a crystal ball either.
Reversal patterns candlestick like the Doji star tend to be more reliable, with success rates closer to 70%. This is likely due to the indecision of the Doji combined with strong confirmation by the engulfing bar that can follow.
Interestingly, one-candle reversal candlesticks pattern like the hammer or hanging man predicted reversals only 45% of the time.
Used in isolation, not even the best reversal candlestick consistently predicts trend reversals with complete accuracy. At the end of the day, good candlestick reversal patterns Forex traders can use are the one that fits cohesively into their own trading plan.
What to Do When You See Reversal Candle Formations
So you've learned to recognize key bullish and bearish reversal candles like a pro.
Congrats!
But now what?
Here is your reversal candlestick patterns cheat sheet for trading price action when you spot these formations:
- Wait for confirmation - Never enter on the first reversal candle alone instead look for a close above/below the pattern for bullish/bearish signals.
- Consider volume - Reversals are stronger when accompanied by a surge in volume because it shows conviction behind the move.
- Use other indicators - Momentum oscillators, moving averages, or overbought/oversold levels can add confluence.
- Identify key levels - Candlestick patterns reversal at major support/resistance levels have higher probability than random formations.
- Scale in - Consider legging into positions in case the reversal fails. Managing risk is crucial.
- Honor your stop loss - Have a pre-determined stop loss set before entry. Stick to this exit strategy if the pattern fails.
- Review your trading journal - Keep track of both winning and losing reversal trades to improve over time.
Using Reversal Candlestick Patterns in Technical Analysis
Mastering individual candlestick patterns is only half the battle; the second part is knowing how to interpret reversals in the greater context of market structure.
Here are three key aspects to analyze:
- Price Action Context - Where are the signals forming relative to recent swing highs and lows? Reversals at key inflection points are highest probability.
- Market Conditions - Are we in a ranging, trending, or breakout market? Different environments call for different reversal strategies.
- Sentiment Indicators - What is momentum, volatility, and investor sentiment telling you? Don't trade against the dominant market tone.
A hammer candle means little without considering the story of price action, market conditions, and sentiment. The wise trader zooms out to understand how reversals fit into the larger picture.
Rather than obsessing over candlestick patterns in isolation, take a step back and analyze the market's structure first and candlestick reversal patterns indicator to confirm your bias. This top-down approach makes reading reversals in real-time easier and more accurate.
The next time you spot a key candle formation, ask yourself - does this align with the current market environment?
Thinking broader is the mark of a truly skilled trader.
Common Mistakes to Avoid While Interpreting Reversal Candlestick Patterns
Even experienced traders make mistakes analyzing key reversal candlestick pattern.
Here are some common errors to avoid with candlestick patterns:
- Trading the first candle in isolation - Never assume one candle predicts the reversal alone but wait for confirmation.
- Getting overeager on oversold/overbought signals - These can persist much longer than you expect during strong trends.
- Assuming all reversals are equal - Pay attention to the high probability key reversal candlestick patterns vs. weak signals.
- Not using stops - Always use protective stops in case the reversal fails.
- Forcing patterns to fit - Don't desperately attempt to make the market fit your bias.
Now that you understand key reversal candlestick patterns, it's time to start applying these techniques in your own trading. If you're looking for a forex and CFD broker with fast execution, great trading tools, and quality education, check out Pepperstone or eToro – for US residents.