The Trading Bible Trading Guides ᑕ❶ᑐ Bullish Candlestick Patterns: Formation, Meaning, Cheat Sheets
Bullish Candlestick Patterns You Need to Know
By Stelian Olar, Updated on: Jul 12 2024.
In this article, we'll explore the most common bullish candlestick patterns - those visual clues that can help you identify when market sentiment is shifting in an upward direction. Whether it's a long white candle, bullish hammer candlestick, morning star, or Doji candlestick pattern, learning to recognize these bullish candlesticks will add a valuable tool to your trading strategy.
Have you ever looked at a chart full of candlesticks and felt lost trying to decipher their meaning?
I remember when I first started Forex trading and saw all these lines and shapes on my screen - it was like trying to read a foreign language. But discovering how to read those candlesticks unlocked a whole new world of understanding market sentiment and momentum.
Trading Forex is often about finding an edge or advantage over the rest of the market, and bullish candlestick patterns give you that insider view into the mindset of buyers and sellers. While no single indicator is foolproof, understanding the bullish candlestick meaning and what they imply about future price direction can help you make smarter trades with higher probability setups.
Consider this your cheat sheet to unlocking the meaning behind all bullish candlestick patterns.
So if you want to enhance your ability to interpret charts and identify high-probability long trade entries, keep reading. You'll not only learn what makes candlesticks bullish or bearish, but also how to take advantage of these bullish and bearish candlestick patterns with concrete trading strategies.
Let's begin deciphering those candlesticks together!
What Is a Candlestick Pattern
Candlestick patterns are visual representations of price action over a set period of time, most commonly formed into the candles we see on all trading charts. Candlesticks were first developed centuries ago by Japanese rice traders to visualize market emotions and dynamics.
That's why they are sometimes referred to as Japanese candlestick charts.
Each candle provides key information about the open, close, high and low of price during the chosen timeframe. But more importantly, the size and shape of the candles can signal bullish candlestick reversal patterns and potential trend reversal points.
Candlestick charting remains one of the most common forms of technical analysis even today.
While there are hundreds of potential candlestick formations, most can be categorized into simple common types:
- Long/short bodies, wicks/tails, and color.
- Long white (green) candles show strong buying pressure, while long black (red) candles indicate heavy selling momentum.
- The wicks or shadows protruding above and below the bodies provide additional clues into resistance or support areas.

When viewed together over a period of time, these candlesticks form patterns that traders analyze to gauge trend reversal points, momentum, and potential future price direction.
Let's examine some of the most common bullish reversal candlestick patterns next.
What Is a Bullish Candle Pattern
In general, a bullish candlestick formation indicates buying pressure is starting to overwhelm selling momentum that tend to precede upside price moves. This tips the supply/demand relationship in favor of the bulls.
Some of the most common bullish candlestick patterns include:
- Long green or white candles showing buyers in control
- Hammers and inverted hammers marking potential reversal points
- Dragonfly doji and bullish engulfing patterns signaling a potential trend change
- Morning star formations and bullish counterattack pattern indicating a turning point
Bullish Candlestick Formations Key Features
The most common bullish candlestick formations all have some traits in common:
- Long white (or green) real bodies - This shows that buyers were dominant during the session and pushed prices higher from open to close. The longer the body, the more intense the buying pressure.
- Little or no upper wick - A small or non-existent upper wick indicates the buying pressure was sustained throughout the session and prices closed near their high.
- Long lower wicks are fine - Having a lower wick shows some selling pressure during the session, but the buyers still overwhelmed the bears to close near the high. No problem here!
Some of the most popular bullish candlestick patterns are the Hammer pattern, bullish engulfing pattern, Piercing Line and Morning Star. I won't bore you by explaining them all here, but know that they build on these key traits.
See how understanding some core concepts makes digesting all these bullish candles much easier?
Instead of memorizing dozens bullish candlestick patterns Forex traders keep in their toolbox, just spot the bullish traits. With a little practice, you'll be able to gauge the market's bullish enthusiasm at a glance.
The Most Popular Bullish Candlestick Patterns
Now let's examine some of the most common and best bullish candlestick patterns top traders keep an eye out for.
Bullish Engulfing Candlestick
The bullish engulfing candlestick is a two-candle bullish reversal pattern that appears after a downtrend:
- It begins with one short red candle.
- Followed by a larger green candle that completely engulfs the body of the first candle, showing buyers have overwhelmed sellers.

Bullish Hammer Candlestick Pattern
The candlestick hammer bullish pattern has a long lower wick and short upper wick, indicating buyers entered after an initial downturn and push the price higher by the close. Hammer candlestick patterns mark a potential bottom bullish reversal after a decline.

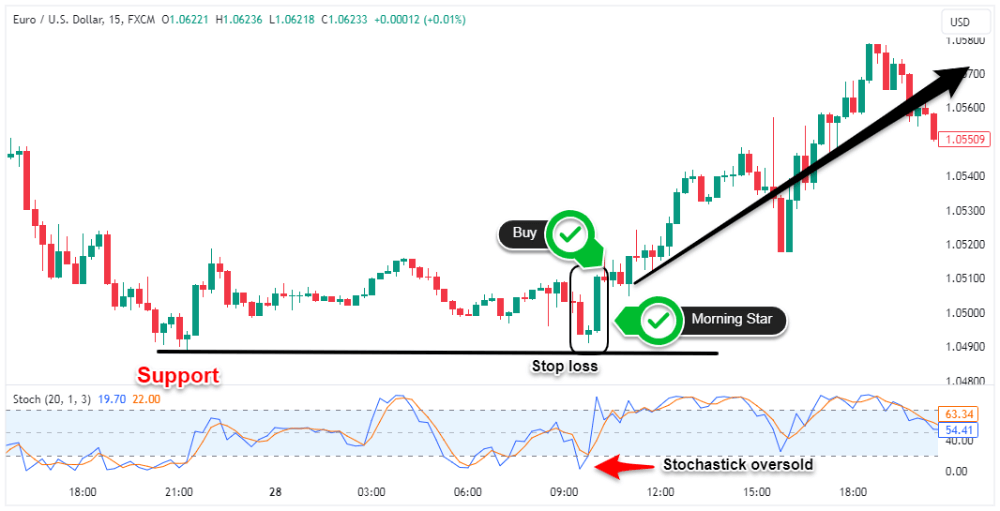
Morning Star
The morning star is a three- candlestick patterns bullish pattern signaling a potential uptrend reversal:
- The first candle is long and bearish,
- Followed by a second candle with small bodies or Doji candle,
- And, the third candle completed by a strong bullish candle.

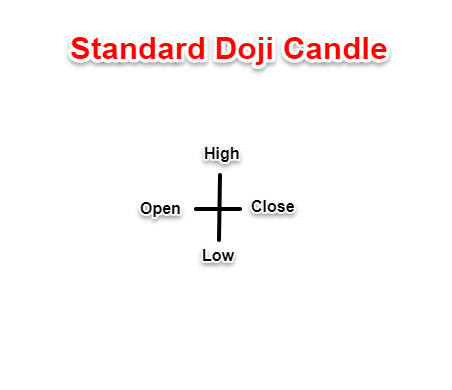
Bullish Doji Candlestick Pattern
The bullish reversal Doji candlestick has an open and close at the same price level, creating a cross-like appearance. This indecision candle marks a potential turning point after a downtrend but it can also act as a bearish reversal signal if it shows up at the top of an uptrend.
And, let’s not forget that the Doji candle has some variations like the bullish dragonfly doji candlestick and the bullish gravestone doji candlestick.
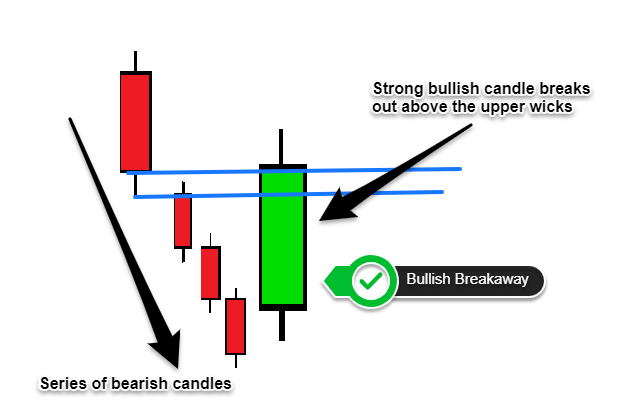
Bullish Breakaway
The bullish breakaway candlestick pattern starts with a series of declining candles in a downtrend. It is completed by a strong bullish candle that breaks out above the upper wicks of the previous candles, showing a potential trend reversal.
Bullish Dark Cloud Cover
Despite its name, the bullish dark cloud cover candlestick can be both bullish and bearish reversal candlestick patterns. It starts with a long green (bullish) candle, followed by a long red candle that dips below the midpoint of the first candle. Sellers initially overwhelm buyers but are unable to sustain the momentum.
There are many more candlestick patterns, like the bullish cross candlestick pattern, bullish divergence candlestick, bullish counterattack candlestick pattern, and bullish gap up candlestick pattern.

How to Trade Bullish Candlestick Patterns
Here are some tips for applying these candlesticks:
- Use bullish reversals like hammers and dojis to identify potential long entries after a downtrend. But wait for confirmation before entering.
- Look for bullish divergences between price action and indicators like MACD or RSI to strengthen the bullish candlestick signals.
- Combine candlestick patterns with support/resistance to find optimal entry points and stop loss placement.
- Focus on the best 1-2 reversal candlestick patterns that fit your trading style and setups. Too many conflicting signals can be overwhelming.
- For the best bullish candlestick patterns for day trading, the most reliable signals are engulfing and counterattack patterns.
- Give trades room to move rather than exiting at the first sign of profit.
Risks Associated with Trading Bullish Candlestick Patterns
No single bearish and bullish candlestick patterns provide a guaranteed signal - the broader technical picture must be considered. A long white candle may emerge right as the price hits a key resistance level and reverse, despite the bullish implication.
Or bullish continuation candlestick patterns like a high wave candle could form within a broader downtrend, leading to losses if traded incorrectly.
Candlestick signals are also prone to subjectivity in interpretation. One trader may see the start of an uptrend while another sees a bearish evening star reversal in the same long upper shadow candles and open short positions.
Perhaps the biggest risk comes from over-reliance on candlestick patterns for trading decisions – remember these patterns are just one useful tool, not a trading system.
Download Bullish Candlestick Patterns Cheat Sheet in PDF
Learning to identify and interpret bullish and bearish candlestick patterns is an invaluable skill for traders.
That's why we've created a simple one-page cheat sheet summarizing the major bullish candlestick patterns cheat sheet. Keep it by your computer while analyzing charts so you can act fast when high-probability setups emerge.
To continue enhancing your trading skills, start your trading journey with Pepperstone (or eToro if you’re a US resident) to access award-winning trading conditions and support.
Bullish Candlestick Pattern |
# of Candles |
Short Description |
Buy/Sell Signal |
|
Bullish Engulfing |
2 |
Larger bullish candle engulfs body of preceding bearish candle |
Buy after two candle formation completes |
|
Hammer |
1 |
Bullish candle with small lower wick and large upper wick |
Potential buy entry if confirmation candle follows |
|
Piercing Pattern |
2 |
Bullish candle pierces into body of previous bearish candle |
Buy once second candle completes pierce |
|
Morning Star |
3 |
Bullish candle confirms reversal after indecision/small range candle |
Buy after third candle confirmation |
|
Bullish Doji |
1 |
Doji cross indicates indecision and potential reversal |
Look for buy entry confirmation next candle |
|
Bullish Breakaway |
5+ |
Bullish candle breaks out above preceding downtrend |
Buy on breakout with stop under low |
|
Bullish Counterattack |
2 |
Strong bullish candle engulfs body of previous bearish candle |
Buy on close of second bullish candle |