The Trading Bible Trading Guides Exponential Moving Average (EMA) Indicator Explained
Exponential Moving Average (EMA) Indicator Explained
By Stefano Treviso, Updated on: Apr 07 2023.
Table of Contents:
- What is an Exponential Moving Average (EMA)?
- How is the Exponential Moving Average (EMA) Calculated?
- Example of Exponential Moving Average Calculation
- Exponential Moving Average (EMA) vs. Simple Moving Average
- How to use the Exponential Moving Average (EMA)?
What is an Exponential Moving Average (EMA)?
An Exponential Moving Average is a type of moving average that gives more weight (importance) to recent prices in its calculation, this causes it to react quicker to recent price changes.
In a Simple Moving Average, there is no weighted approach, we simply add together the closing prices of the amount of periods we want to average and divide them by that period, that's it.
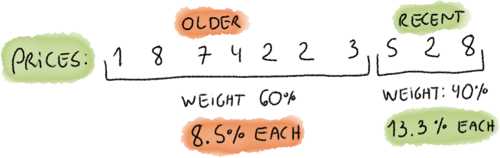
In an exponential moving average more weight will be given to recent prices. If you look at the image below, it gives you a rough idea (just as an example, not an accurate representation of how the formula works) of what it means to have different weights on each one of the exponential moving average points used in the calculation.
Featured Technical Analysis Brokers
| FP Markets | |
|---|---|
| MetaTrader 4 | Yes |
| MetaTrader 5 | Yes |
| TradingView | No |
| Pepperstone | |
| MetaTrader 4 | Yes |
| MetaTrader 5 | Yes |
| TradingView | Yes |
| eToro | |
| MetaTrader 4 | No |
| MetaTrader 5 | No |
| TradingView | No |
How is the Exponential Moving Average (EMA) Calculated?
If you started with our Simple Moving Average guide, you probably remember that we can choose periods for our calculation, right?
Well, the first variable we need to define in our calculation is the period, let's use period 5 in this example.

With the time period being equal to 5, the calculation above will look like this: (2/(5)+1) and the result is: 0.33333333 and that means our multiplier equals 0.33 then.
Now, the formula below is where the Exponential Moving Average is born and we're sure you have some questions.
If to calculate today's Exponential Moving Average I also need the one from yesterday, how the hell am I supposed to do this?
Easy. In the first EMAs required in your formula you'll use a Simple Moving Average as the initial value.

Let's do a quick example before we jump into the real calculations:
- Today's closing price is: 10$
- Yesterday's Exponential Moving Average doesn't exist, so we use a Simple Moving Average which equals to 10.2$
- Our Multiplier is 0.33.
What's our Exponential Moving Average value? Easy:
(10-10.2)*0.33+10.2 = 10.134
That's our first EMA point and now for the next points it's easier as we already have the previous EMA calculated. So on the next day the EMA Previous day value you see on the formula should be 10.134.
Example of Exponential Moving Average Calculation
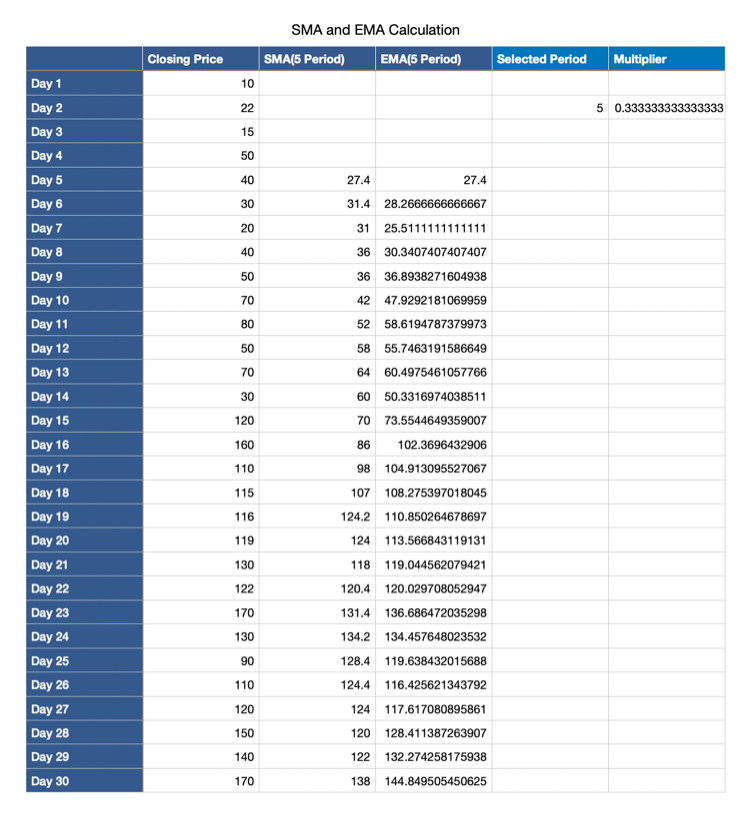
In the table below, you'll find 30 days worth of price data. You can do it yourself also using any spreadsheet software!
Notice how we chose the selected period to be 5. So our SMA and EMA Calculations are based on 5 days of data (closing prices).
The 27.4 value which is the first one in the SMA column it's the starting point for our EMA calculation, remember, you don't have it on the first one so you need to use the SMA as your first value.
The rest of the table is rinse and repeat the formula.
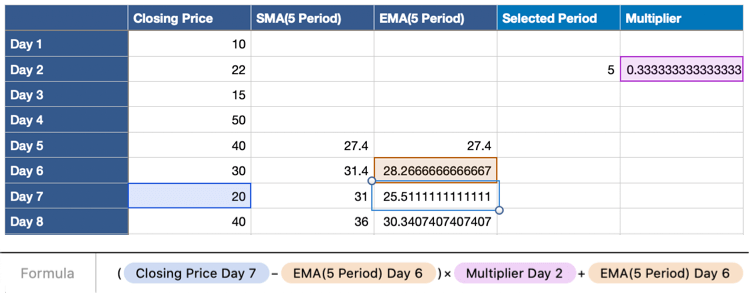
In the image below, you'll see the spreadsheet software highlighting the formula we did.
If you analyze it slowly, you'll notice that it's exactly as we described above in the formula image. Don't get confused by the part that says Multiplier Day 2, that's just the spreadsheet software pointing that the Multiplier row we're using is named Day 2. The multiplier is only 1 for the whole calculation.
Try to do this calculation yourself using a few days of price data and any spreadsheet software it will help you grasp the technique. Below, when we get to the part of how this table looks on a chart, you'll understand the difference between an exponential moving average and a simple moving average.
Exponential Moving Average (EMA) vs. Simple Moving Average
Here it is! The chart below shows us the following:
- Green Line: closing price.
- Blue Line: SMA (5 Period).
- Red Line: EMA (5 Period).
The first thing you'll notice is that the price line it's crazy. That is because we're looking at closing prices without any smoothening. One day it closed at 170 and the other day it closed at 90, so it's bound to look a little crazy.
Look closely at the blue line which is the SMA, you'll notice that it follows the movement of the price but smooths out the noise of large price swings and gives us a soft version of the price behaviour to look where it's really going.
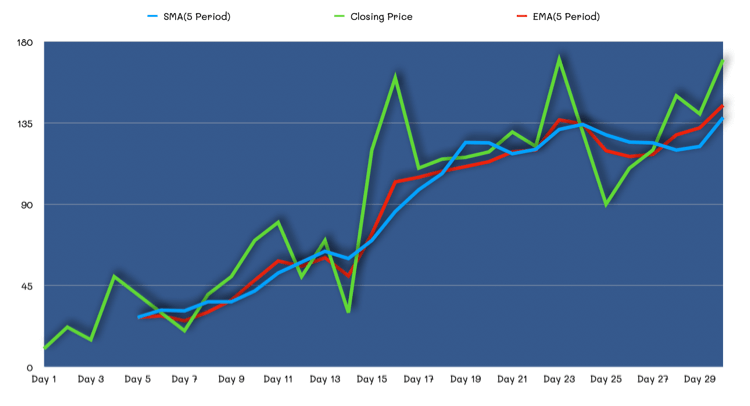
Now, look at the red line (EMA) in comparison to the blue line (SMA). Both are very similar, but can you see how the red (EMA) line responds much quicker to large price changes and also how when we reach the right side of the chart we can clearly see a bigger gap between the two lines when we're faced with strong price action?
That's because the exponential moving average is reacting much more quicker and giving more weight to those recent price changes.
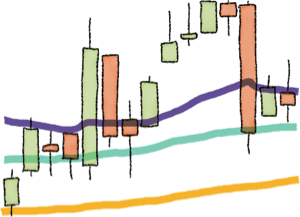
How to use the Exponential Moving Average (EMA)?
Exponential Moving Averages (EMA) allow you to get a sense of the real trend of an asset by looking at a smoothened version of the price action in the chart.
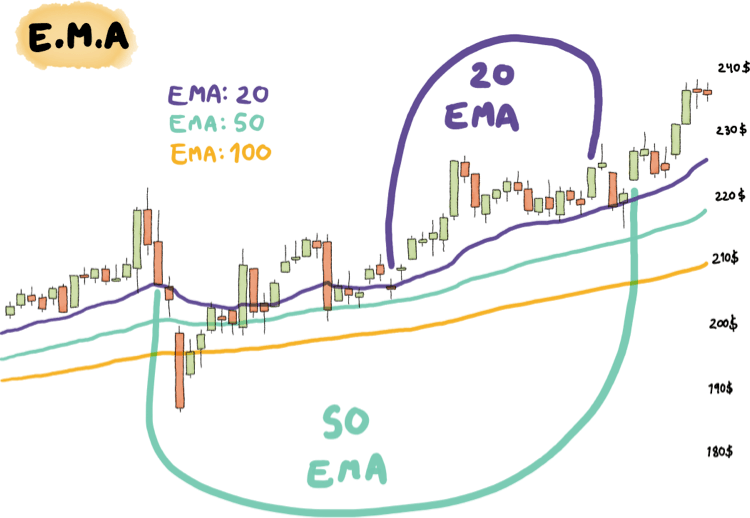
In the example below you can look at a candlestick chart where we drew a 20, 50 and 100 period EMAs.
The huge curves are just to show you that for example in the 20 period, there is 20 days worth of closing prices data being used for the calculation.
Notice how the longer the period, the smoother the line.
In the end the Exponential Moving Average (EMA) is just an improved version of the Simple Moving Average (SMA) which allows you to look at the average with more importance on recent price changes.
No matter how simple this sounds:
- If the EMA line is pointing up, you're looking at an uptrend.
- If the EMA line is pointing down, you're looking at a downtrend.
Traders love to use moving averages to understand how far away the price is from it's average. That way they can test for reversals in either direction when they believe that the price got really far away from it's average.
Now go ahead and use your trading platform to look at several charts and apply different period EMAs on them and start testing which configuration you like more for your strategy.
Other Interesting Articles from Different Authors
- EMA Indicator - A guide on moving averages by Good Crypto app