The Trading Bible Trading Guides Simple Moving Average (SMA) Indicator - Definition & Example
Simple Moving Average (SMA) Indicator
By Stefano Treviso, Updated on: Apr 07 2023.
Table of Contents:
- What is a Simple Moving Average (SMA)?
- How is the Simple Moving Average (SMA) Calculated?
- Example of Simple Moving Average Calculation
- Understanding the Simple Moving Average (SMA)
- Simple Moving Average (SMA) vs. Exponential Moving Average
- How to use the Simple Moving Average (SMA)?
What is a Simple Moving Average (SMA)?

A Simple Moving Average (SMA) is a technical analysis indicator used to visually represent the average price of an asset during a particular number of periods. It serves as a way to reduce the noise caused by volatility and helps in identifying the trend's direction.
Assets can sometimes have erratic price behaviour such as super high opens, lows, gaps and other extreme changes. When we try to average the price behaviour over a particular number of periods we reduce the visual noise on the chart and get a better look.
How is the Simple Moving Average (SMA) Calculated?
The Simple Moving Average is a completely custom indicator, meaning that you can choose the number of periods that you want to average.
That's why sometimes you'll hear terms such as: 200 SMA, 50 SMA, 20 SMA. What this means is that on each point of that smooth line that you see as the SMA a calculation of the average closing prices of the asset for the last 200, 50 or 20 days was plotted.

- CP1, CP2 or CP3 stand for closing prices.
- The number 3 is the selected amount of periods.
In this particular case the formula above serves to calculate a 3 SMA. We're taking only 3 closing prices in consideration and dividing them by 3 periods.
Featured Technical Analysis Brokers
| FP Markets | |
|---|---|
| MetaTrader 4 | Yes |
| MetaTrader 5 | Yes |
| TradingView | No |
| Pepperstone | |
| MetaTrader 4 | Yes |
| MetaTrader 5 | Yes |
| TradingView | Yes |
| eToro | |
| MetaTrader 4 | No |
| MetaTrader 5 | No |
| TradingView | No |
Example of Simple Moving Average Calculation
Let's say we have the following closing prices:
- Day 1: 20$
- Day 2: 22$
- Day 3: 26$
- Day 4: 30$
- Day 5: 35$
- Day 6: 40$
- Day 7: 38$
- Day 8: 34$
- Day 9: 30$
- Day 10: 32$
If we wanted to calculate a 5 SMA then we need to add all prices from Day 10 to Day 6 (in total there should be 5 values) and divide them by 5 (our selected period.
The first point in our SMA Line would equal to: 32+30+34+38+40 divided by 5. The result is 34.8$
Then in order for the line to continue, the calculation needs to happen again but this time we start from Day 9 to Day 5. The new calculation would be: 30+34+38+40+35 divided by 5. The result is: 35.4$.
If we repeat this process as much as we can until we're left without the possibility to use five values, you'll notice how you've managed to create a Simple Moving Average.
Now all you need to do is draw it on a chart manually to practise!
Understanding the Simple Moving Average (SMA)
If you think about it for a second, line charts are really just a 1 Period SMA.
Line charts are made of only plotting the closing price of an asset, that's why line charts have very responsive behaviour towards price changes as we can only see closing prices plotted on them (if you want to know more about this, read our technical analysis for beginners guide).
Based on what we just talked about, we can understand that a simple moving average will become either smoother the longer the periods we use or more noisy the shorter the periods we use.
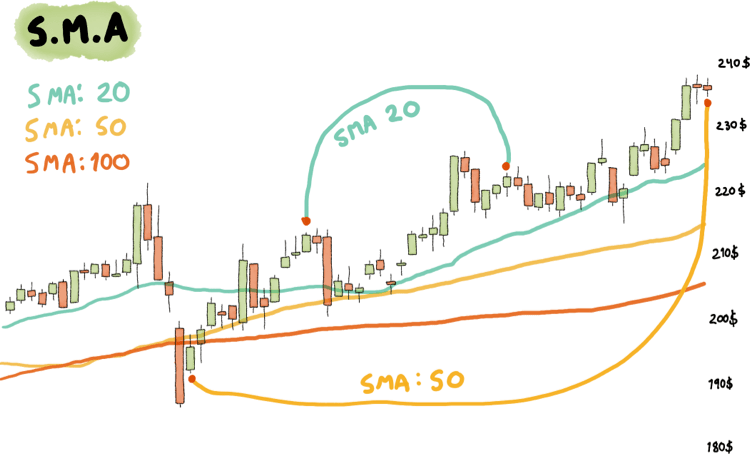
In the example above you can see how a shorter average equals a more responsive line, a longer average equals a smoother line.
The 20 Period SMA is much more responsive in comparison to the 50 or 100 Period SMA.
Simple Moving Average (SMA) vs. Exponential Moving Average (EMA)
The Exponential Moving Average (EMA) is quite similar to the Simple Moving Average (SMA). The main difference is that the exponential moving average uses a weighted approach.
A weighted approach means that not all values (closing prices) are worth the same on the formula, but rather more weight (importance) is given to the most recent values.
In the end, it's a matter of preference. Anyone can come and tell you that they made thousands of dollars with a particular indicator configuration but maybe it worked only for them at the right time and not for everyone.
It's up to you to judge what works best by testing and learning using a demo account.
How to use the Simple Moving Average (SMA)?
The whole point of averaging prices is to be able to reduce the noise of price volatility in charts and be able to spot trends.
No matter how simple it sounds, when we see an SMA line pointing up it means that the overall trend is bullish and when we see the SMA line pointing down it means that the overall trend is bearish. All of this assuming that a significant period is used, for example a 50 SMA or 200 SMA.
Remember, shorter periods are much more full of noise and volatility and they don't allow you to see trends correctly.
Now go and try testing different configurations of the SMA on your trading platform.
Enjoy!