The Trading Bible Trading Guides Trading with Technical Analysis - A Beginners Guide
Trading with Technical Analysis - A Beginners Guide
By Stefano Treviso, Updated on: Apr 07 2023.
Technical analysis is a method to forecast future prices of an asset by studying past price behaviour. Technical analysts believes that price charts contain all the significant and relevant data to make decisions. The main idea behind it is that all the relevant information that could affect an asset is already factored in the price itself.
- Principles of Technical Analysis
- The market discounts everything
- Prices move in trends
- History tends to repeat itself
- Technical Analysis Basics
- Japanese Candlesticks
- Support and Resistance levels
- Trends
- Technical Analysis vs. Fundamental analysis
- Conclusion
Principles of Technical Analysis
In order to understand the logic behind technical analysis and how could they even make such a huge statement, let’s take a look at their principles:

The market discounts everything
The phrase “the market discounts everything” can be translated into: “its all in the chart”. Technical analysts believe that everything that happened, is happening and could happen to any asset’s price, is already factored in, so in theory we could say that there’s no unknown information to the price and just by looking at its past and present behaviour we could make fairly accurate predictions of potential future directions.
Prices move in trends
A “trend” is the overall direction where something is moving to and we can usually see it when we eliminate the noise caused by short term volatility. If you pickup the chart of any stock and forget about hourly price changes but rather look at it on a daily timeframe, you’ll notice that it was going either up or down for a prolonged period of time.
Technical analysts use this well known behaviour to try and guess when are this trends happening, how long they could last and if they can turn around, all with the objective of finding the right entry and exit points.
History tends to repeat itself
The phrase “history repeats itself” can be translated into: “if it happened once, it could definitely happen again”. Technical analysts know that investors tend to have repetitive behaviour over the course of history and during some key points they react in the same way as they did before.
For example, if a stock in the past has dropped 20% every time it reach the 100$ mark, it’s likely that it does it again.
Featured Technical Analysis Brokers
| FP Markets | |
|---|---|
| MetaTrader 4 | Yes |
| MetaTrader 5 | Yes |
| TradingView | No |
| Pepperstone | |
| MetaTrader 4 | Yes |
| MetaTrader 5 | Yes |
| TradingView | Yes |
| eToro | |
| MetaTrader 4 | No |
| MetaTrader 5 | No |
| TradingView | No |
Technical Analysis Basics
In order to get started in technical analysis we need to start by speaking the language of charts and understanding the most common tools used when looking at them.
Many years ago, when a trader looked at a line chart, he could only see a single price represented, for example, the closing price of the day for a particular asset plotted into a line chart.

It was clear that a lot of information concerning the “price action” (price movements) was missing in those charts to be able to make informed decisions and that’s where our new tool comes in hand, Japanese candlesticks.
Japanese Candlesticks
Japanese candlesticks are a tool to visually represent more data in a price chart by allowing traders to gain knowledge of the open, close, highest and lowest prices of an asset during any given session.
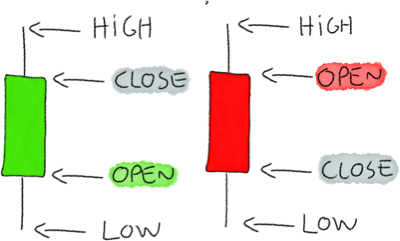
A candlestick is composed of a body, a lower wick and an upper wick, let's discuss each part individually:
Upper wick: the highest price reached during a given session.
Lower wick: the lowest price reached during a given session.
Body: it shows the open and close price, depending on its color or size can mean different things, let’s look at them:
- Green: when the close price is higher than the open price.
- Red: when the close price is lower than the open price.
- No color: when the close price is the same as the open price, so the candle has no body at all.
Bear in mind that colours are not always the same, some trading platforms can choose to consider a purple candle as the positive candle and a yellow candle as the negative one, this tends to be a customisable feature.
Support and Resistance levels
Support and Resistance are key price levels where reversals can potentially happen, lets look at each case:
Support

Support is a specific level where prices can turn back up (as they have done so in the past) due to a large concentration of demand (buyers) at that specific price.
Resistance

Resistance is a specific level where prices can turn back down (as they have done so in the past) due to a large concentration of supply (sellers) at that specific price.
The concepts of support and resistance go hand in hand with the third principle of technical analysis which states that if something happened before, it could happen again.
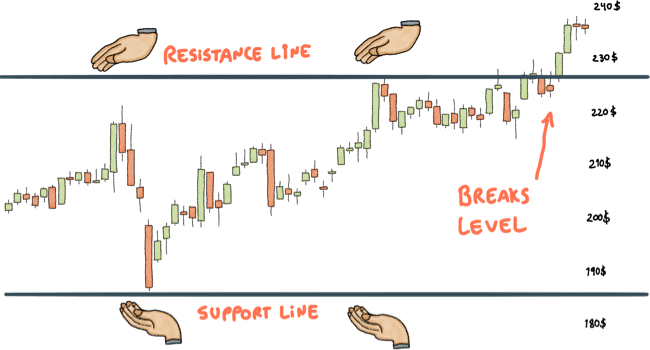
Now you know that just by looking at a chart and identifying where support or resistance levels occurred previously, you can forecast a potential price behaviour.
Trends
As we learned from the second principle of technical analysis, prices don’t just go swinging erratically, they have an overall direction over prolonged periods of time and that is what we call a trend.
The market can only go three different ways: up, sideways or down. Usually when we talk about trends we refer to the two main types:
Bullish Trend (going up)
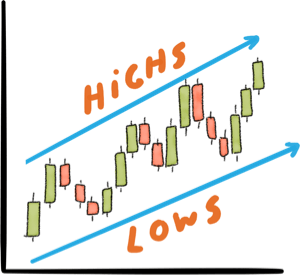
To spot a bullish trend, look for the following pattern:
- Higher highs
- Higher lows
Bearish Trend (going down)

To spot a bearish trend, look for the following pattern:
- Lower highs
- Lower lows
Charles Dow, one of the greatest analysts that ever lived, stated that trends persist until a clear reversal occurs, in other words, the trend is your friend.
A lot of new traders go wild trying to behave like George Soros by betting against assets or opening shorts on bullish trends and fail spectacularly, it takes time and practise to master such an art so better play it safe.
Technical Analysis vs. Fundamental analysis
Fundamental Analysis is about determining the intrinsic (real) value of an asset. For example, if a fundamental analyst wanted to determine the real value of Apple’s shares, he would look at their investors report, revenue, earnings, recent events and try to calculate a proper value for their share based on several of these variables.
A Technical Analyst would just look at the price chart and work using that information as his main source.
Despite a lot of people trying to measure technical analysis against fundamentals just like if it was a competition of Mac vs. Windows, we assure you, there’s no point in doing so.
When we trade, we only care about making money, not how or which way we make it. It doesn’t matters if your doing technical analysis combined with dark magic and voodoo, if it works for you, it works.
Never let yourself be guided by what other people think, make your own conclusions by testing as many methods as possible and finding yours.
Conclusion

If you remember these points, they might change completely your next encounter with a trading chart.
- Prices move when there’s active buying and selling.
- This buying and selling is performed by humans or by computers programmed by humans.
- Charts are a footprint left by the decisions made by other humans.
This last point is worth gold, and the reason is that sometimes people try to look at technical analysis like a mystic science that provides spiritual answers by applying 2000 indicators into a chart, and that’s not at all the objective.
The main objective is observe the human behaviour and the footprints left from previous price action in order to try and guess what could happen next, because history has always shown a tendency to repeat itself and markets don’t go swinging erratically in circles, they move in trends.
Good luck!