The Trading Bible Trading Guides Price Action Trading Explained | Complete Beginners Guide
Price Action Trading Explained | Complete Beginners Guide
By Stefano Treviso, Updated on: Apr 07 2023.
Here's what we'll talk about in our Beginners Price Action Trading guide:
- Price Action Trading Explained
- Does price action trading really work?
- The Logic behind price action trading
- Psychology of Candlesticks
- The Top Price Action strategy every trader should know
- Support
- Resistance
- Breakouts
- How to master price action?
Price Action Trading Explained
Price action is the study of how an asset's price behaves over time. If a stock’s price goes up a price action trader usually doesn’t care to explain the fundamental reasons of why this happened, he uses price behaviour as his main source of information to make trading decisions.
One of the best ways to understand the concept of price action is to break it down it and change the order of the words:
Price: “the amount of money given or set as consideration for the sale of a specified thing”.
Action: “the manner or method of performing”.
Now that we know what each word means, let’s change the order from “price action” to “action of the prices”.
So what we’re doing is studying the manner (action) that the value of an asset (price) performs over time.
See? Now it begins to make much more sense.
Does price action trading really work?
In order to answer this question, we need to understand why price action trading even makes sense in the first place and there’s no better way to do this than looking at a chart together.
During your trading career you’ll find that a lot of new traders get into price action into a mechanical way, they simply look at a pattern on a chart and expect something to happen just because the pattern is there, it could be “head and shoulders” or whatever pattern you choose (we’ll talk about them as we move through the guide). The thing is that there’s actually some strong reasons for all of this to make sense, beyond recognising patterns, here’s why:
When a new trader sees this chart, he simply analyses the fact that there could be a potential breakout about to happen because that’s what he was told.
But if you stop for a second and think, what determines the potential actions of the price? Well, the actions of the buyers and sellers! They are the ones responsible for driving the price and generating price action, right?
Now let’s look at the same chart and imagine it’s telling us a story and that this story is based on the actions that buyers and sellers performed in the past.
So what is the story saying?
- Every time the price reached a certain upper level, there was a large concentration of supply that knocked it down (meaning there were a lot of sell orders in that level).
- Every time the price reached a certain bottom level, there was a large concentration of demand that drove the price back up (meaning there were a lot of buy orders in that level).
- When the price reached that upper level and there was not enough supply to hold the price up, it took off and that’s why in this precise scenario it's called a breakout.
The most important thing to learn from this story is that all these things happen because buyers and sellers are taking actions that ultimately affect prices in a certain way and precisely because these observable patterns occur we can arrive at potential predictions of future price behaviour.
Featured Technical Analysis Brokers
| FP Markets | |
|---|---|
| MetaTrader 4 | Yes |
| MetaTrader 5 | Yes |
| TradingView | No |
| Pepperstone | |
| MetaTrader 4 | Yes |
| MetaTrader 5 | Yes |
| TradingView | Yes |
| eToro | |
| MetaTrader 4 | No |
| MetaTrader 5 | No |
| TradingView | No |
The Logic behind price action trading
As you can see, the concept of price action is linked closely to the concept of technical analysis as both disciplines make use of each other, but price action tends to be more flexible and give more of a freestyle approach to making decisions.
The hardest part to really understanding price action is that traders are always looking for a perfect answer when it comes to finding the right entry or exit points from a trade and here we believe that taking a mechanical approach to things is not a good a idea, let’s talk about why:
Trying to interpret trading patterns in a mechanical way can lead to making a lot of bad decisions, for example, if every time you see a pattern you make the same decision, then you’re not thinking much really, you’re just looking for something that someone else determined long ago for you and executing decisions based on that.
What if instead of just looking for pre-made patterns you start thinking in a different way about those candlesticks and try to rationalise why they have certain shapes?
Psychology of Candlesticks
Japanese candlesticks (which we explained already in our technical analysis guide) are the main tool for us to look at price action as they provide a great amount of information related to the prices, now, when we’re looking at them as we said before, we need to take a more open minded approach to understand what they really mean.
So far we know that price action is the result of the actions of buyers and sellers that ultimately move prices up, down or sideways, right?
Well taking into consideration that we want you from now on to start looking at each individual candle like a battle between bulls (buyers) and bears (sellers).
Each one of these battles leaves a footprint on the chart, let’s take a look at a great example and analyse what is this candle telling us:

What happened here? We’re looking at a candle made of a small body and a huge lower wick.
What the candlestick is really telling us is much more than “oh look, a hammer candle!”, we’re looking at a battle between bulls and bears during that particular time period and clearly during the battle bears managed to make a huge push and drive the prices down but bulls managed to save the day and bring the price back up, but not by much (that’s why you see a small body).
So after analysing it this way, now we can at least guess that there still might be a lot of selling pressure accumulated waiting to be unleashed in the next candle.
If you start practising and looking at candlesticks in such a way, then you’ll start developing the ability to read charts in a different way, because in the end what you want is to be able to look at a price chart and understand what were the actions of buyers and sellers and what could happen next.
The Top Price Action strategy every trader should know
There are many different patterns and strategies, but there’s one that is considered the pillar of all price action. It consists of understanding support and resistance so you can then scout for breakouts.
Support and resistance are key psychological price levels where there is a high concentration of demand or supply and price reversals can potentially occur. Always remember that when we talk about these levels we’re never doing so in very short timeframes, the longer the time period of the chart the more significant the level.
Support
If the price of an asset bounces back up after hitting a specific level several times, you’re likely looking at a support level as there’s a large concentration of demand at that specific price area.
Resistance
If the price of an asset falls back down after hitting a specific level several times, you’re likely looking at a resistance level as there is a large concentration of supply located at that specific price area.
Bear in mind that for both cases, we’re not talking about them happening only one time, the more this scenario repeats of a price hitting a specific level and reversing, the stronger and more significant the level becomes.
Great, now that we’ve got the basics settled we can look at breakouts and breakdowns.
Breakouts
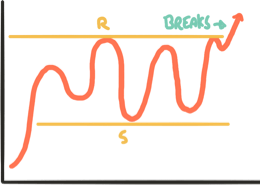
Breakouts occur when the price breaks a support or resistance level and continues climbing or falling past that level. The main problem is that many traders memorise this strategy in a mechanical way and assume that just because the price of an asset broke the level they are 100% sure that it will continue moving past it. The best way to protect yourself against this is never jumping in too early and waiting to see if this could be a false breakout or not.
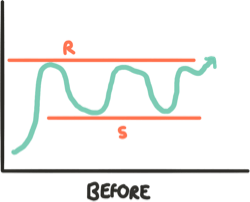
This is how breakouts usually look like:
Now that we have a fair idea let’s try to find the logic behind this price action, it’s really not that complex.
Imagine that every time the market price approaches that upper resistance level, it's eating through available sell orders and when there are too many of them the price goes back down. The change comes when at some point the price approaches that level and encounters very little resistance as there’s not enough supply and simply breaks higher, triggering all the sellers to halt their sell orders and wait to sell at a better price.
So if we also wanted to explain this scenario of a false breakout:
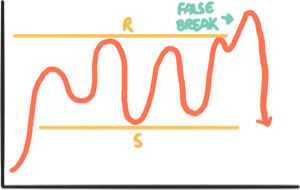
We can say that the moment the price broke the level as it encountered very little supply to hold it there, sellers where cautious in removing their sell orders quickly to let the price lift up again but they still decided to sell shortly after to ensure having the demand necessary to unload their positions at a price where they would still be in profit and this exact behaviour is what triggers the false breakout and pushes the price back down again.
Ultimately, remember that the actions of buyers and sellers is what determines prices, so studying price action carefully is what helps us understand what is really happening in the markets.
How to master price action?
Never trade using a mechanical approach, just because someone said that every time there’s a “head and shoulders” pattern or a “breakout pattern” something will happen, doesn’t mean that they’re right. It’s your job to try and analyse the situation using several approaches to arrive at the best conclusions possible.
The markets have an evil nature, that’s the most important key to actually master price action and here’s why:
When you see the price of an asset rising, you might be thinking: Oh great! It’s going up, but what could really be happening is that big market players are pushing the price a little up in order to trigger the demand that they needed in the first place to unload their assets at an optimum price.
The whole point is to try and look at the chart using that evil logic and guess what happened, what’s happening and what could happen next.
So in order to master price action, look at as many charts as you can, think as bad as possible and ask yourself a lot of questions.
Good luck!