The Trading Bible Trading Guides Law of Supply and Demand Explained
What are the laws of supply and Demand?
By Stefano Treviso, Updated on: Apr 07 2023.
The law of supply and demand explains how buyers and sellers interact with each other by analysing their desire to buy or sell according to different price and quantity levels. At lower prices buyers want more and suppliers are willing to provide less, at higher prices, buyers want less and suppliers are willing to provide more.
In a free market, supply and demand determine market prices as buyers and sellers are constantly fighting each other.
To understand supply and demand as a whole we need to study each law individually and several scenarios that can occur such as equilibrium, disequilibrium or excess in either of them. Here’s what we’ll explain during our guide:
- What is the law of Supply?
- What is the law of Demand?
- Equilibrium Explained
- Disequilibrium Explained
- Excess of Supply
- Excess of Demand
- Shifts in Supply and Demand
- Shift in Demand
- Shift in Supply
- Conclusion
What is the law of Supply?
The law of supply states (assuming any other factors remain constant) that:
- The higher the price, the higher the quantity supplied
- The lower the price, the lower the quantity supplied
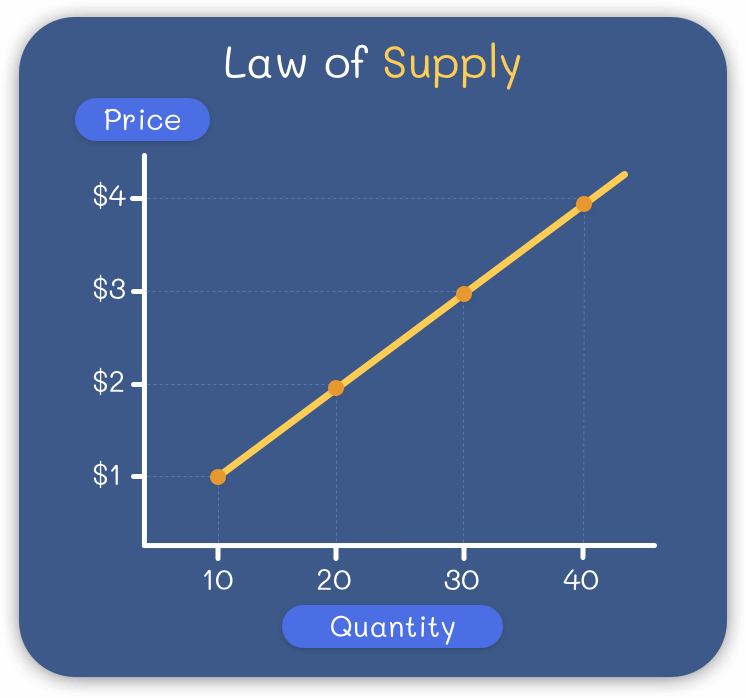
If prices are higher, suppliers want to sell more as selling more quantity at a higher price will result in more profits, on the other hand, when prices are lower, they are not incentivised to increase production as profitability is low.
In simple words, the law of supply is analysing the relationship between quantity and price from the sellers point of view. The result is a linear relationship as the more you increase the price, quantity supplied will increase as well.
Featured Brokers for Beginners
| Broker | Top Features |
|---|---|
| |
| |
|
What is the law of Demand?
The law of demand states (assuming any other factors remain constant) that:
- The lower the price, the higher the quantity demanded
- The higher the price, the lower the quantity demanded

If prices are lower, buyers are willing and able to buy more of any good or service, on the other hand, if prices are high buyers are not willing or able to buy more in comparison with a lower price.
The law of demand has an inverse relationship as higher prices results in lower quantities demanded and lower prices results in higher quantities demanded.
Equilibrium Explained
Equilibrium happens when supply meets demand, meaning that producers are supplying the exact quantity at the exact price that also buyers are willing to buy.
In our example chart below, you can see in price level $2.5 and quantity 25 both suppliers and buyers are at their perfect point.

Equilibrium does not happen in real life as there are millions of variables affecting constantly the demand or the supply. Markets are never still on a particular point where everyone is happy, that’s why prices are constantly changing.
Disequilibrium Explained
When supply and demand points are off as both buyers and sellers are not meeting each other, disequilibrium occurs. In this particular situation no one is satisfied, let’s take a look at each case:
Excess of Supply
Excess of supply occurs when producers are pushing a high quantity at a higher price and buyers are not willing to buy as their desire at such a price is for a much lower quantity than the one being pushed into the market by suppliers. The price is too high.

In our example above you can see that:
- Suppliers (yellow line) are offering point two (40 units at a price of $4)
- Buyers (green line) are willing to buy at point one (10 units at a price of $4)
The natural forces of supply and demand will cause producers to diminish the quantity they’re producing along with the price in order to not waste their production.
Excess of Demand
Excess of demand occurs when buyers are willing to buy a high quantity at a low price yet suppliers are offering a low quantity at a low price which cannot meet the demand. The price is too low and suppliers are not motivated to produce.

In our example above you can see that:
- Buyers (green line) are willing to buy at point two (38 units at a price of $1)
- Suppliers (yellow line) are offering point one (10 units at a price of $1)
The natural forces of supply and demand will cause suppliers to raise prices and produce more to meet the demand that is willing to accept that new price.
Shifts in Supply and Demand
Shifts in supply and demand occur when the quantity demanded or supplied changes by any other reason that is not the price itself.
So far in everything we explained the movement in either demand or supply was always along the line itself, for example: in the chart of the law of supply, we increased from quantity 10 to quantity 20 and the price increased from $1 to $2, a linear movement along the curve.
This is fine assuming that supply or demand stays the same, but what happens when there are changes that affect them?
Simple, the position of the curve will change to a new level that accommodates current supply or demand, let’s take a look at how does this work:
Shift in Demand
A shift in demand occurs when the quantity demanded changes by any other reason that is not the price itself.
A good example of this would be that almost every coffee factory in the world closes and only one remains open.
The demand for that particular brand of coffee will skyrocket instantly.

In our example above we can see that:
- At point 1, the quantity demanded was around 12 units at a price of $3
- At point 2 (our new demand curve) we can see that the quantity demanded changed from 12 to almost 30 units at the same price.
As you can see, prices never changed, but demand skyrocketed, the demand curve shifted its position to the right.
Shift in Supply
A shift in Supply occurs when the quantity supplied changes by any other reason that is not the price itself.
Some good examples would be:
- A natural disaster pauses 50% of the United States oil production
- A plague destroys 90% of the wheat fields in the world

In our example above we can see that:
- At point 1, the quantity supplied was around 35 units at a price of $3
- At point 2, the quantity supplied is 20 units at a price of $3 as well
The price of 3$ never changed but the quantity dropped by 15 units, the supply curve shifted its position to the left.
Conclusion
The law of supply and demand is one of the most powerful pieces of knowledge you can acquire as it’s present everywhere, for example:
- The extremely low supply of talented football players combined with the high demand for them yields a result of football stars being valued at super high prices.
- If a government passes a law forcing suppliers to sell a product at a specific low price, this will demotivate them to produce and also skyrocket the demand.
- If a plague destroys 50% of the world’s coffee production, the quantity supplied changes immediately and is not able to meet the demand causing prices to rise.
For anyone interested in finance, economics or trading, this piece of knowledge is worth gold.
Monitoring what could have caused a shift in the supply or demand of a particular asset is the art of spotting trading opportunities using logic and analysis.
As a fun exercise, try to pick a particular commodity such as gold, coffee or oil and investigate:
- Who’s involved in the market?
- Who are the buyers and sellers?
- What is happening to the buyers and sellers?
- How did the price of oil react when something happened to either of them that could have caused a shift in supply or demand?
Have fun!