The Trading Bible Trading Guides Bollinger Bands Indicator - The Complete Beginners Guide
Bollinger Bands Indicator - The Complete Beginners Guide
By Stefano Treviso, Updated on: Apr 07 2023.
Welcome to the ultimate guide on Bollinger Bands, one of the world’s most well-known technical analysis indicators! Here's what we'll explain:
- Bollinger Bands Explained
- Bollinger Bands Settings
- How to use Bollinger Bands?
- How to Calculate Bollinger Bands?
- Bollinger Bands Formula
- Calculating Bollinger Bands using a Spreadsheet Software
- Bollinger Bands Trading Strategies
- Bollinger Bands Squeeze Trading Strategy
- Overbought and Oversold Trading Strategy with Bollinger Bands
- Conclusion
- Frequently Asked Questions
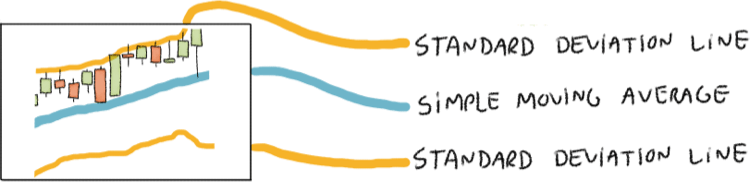
Bollinger Bands are composed of a simple moving average and two standard deviation lines which we know as the upper and lower bands.
Traders use Bollinger Bands to try and guess when the market is overbought and oversold by looking at how the prices interact with both bands. Now, what does this all mean? Let’s find out.
Before we start, nothing is more important than honouring the creator of Bollinger Bands. As you’ve probably seen in our website we love to draw our own cartoon versions of very important historical figures, so here it goes for Mr. John Bollinger, the creator of Bollinger Bands.

John Bollinger is one of the world’s most famous technical analysts. If you don’t know, technical analysis is a discipline that aims at forecasting future prices using only past price behaviour (looking at charts with old prices).
Before Mr. John Bollinger revolutionised the technical analysis world, chartists were using fixed width bands which were not responsive to volatility. Thanks to his invention, bands became much more useful in the art of forecasting future prices through technical analysis.
If you want to check out his website, click here.
Featured Technical Analysis Brokers
| FP Markets | |
|---|---|
| MetaTrader 4 | Yes |
| MetaTrader 5 | Yes |
| TradingView | No |
| Pepperstone | |
| MetaTrader 4 | Yes |
| MetaTrader 5 | Yes |
| TradingView | Yes |
| eToro | |
| MetaTrader 4 | No |
| MetaTrader 5 | No |
| TradingView | No |
Bollinger Bands Explained
Bollinger Bands are a technical analysis indicator made of a simple moving average and two lines known as the upper standard deviation and the lower standard deviation. Here’s how Bollinger Bands usually look:
By the way, we heavily recommend that you read our simple moving average guide before moving forward.
So, what is a Standard Deviation? Well, ask yourself this question:
- How far away, or how spread out is the price data from the average?
That’s exactly the whole point of a standard deviation, it’s a measure of spread and it gives us the boundaries to answer that question.
We will calculate it manually during our guide so don’t worry, as of now, the main objective is to understand Bollinger Bands’ components and their functions.
So now we know, Bollinger Bands are made of a simple moving average (usually a 20 period SMA) and an upper band (upper standard deviation) and a lower band (lower standard deviation).
One of the main points of Bollinger Bands as a technical analysis indicator is to track how far away are the prices from the SMA in order to determine if an asset is overbought or oversold.
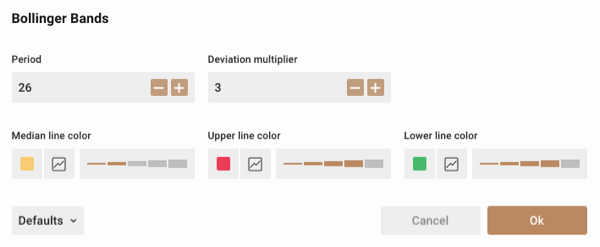
Bollinger Bands Settings
As most technical analysis indicators, Bollinger Bands can be customised if you modify the initial parameters, for example:
- Changing the Periods of the SMA and making it instead of 20, a 50 SMA.
- Changing the Standard Deviation Multiplier (this answers the question of how many standard deviations you want to use in your Bollinger Bands).
Good trading platforms usually allow you to customise Bollinger Bands, here’s how the configuration window could look:
And to make things more interesting, here’s a clear example of how changing the Standard Deviation Multiplier will show itself on the chart:
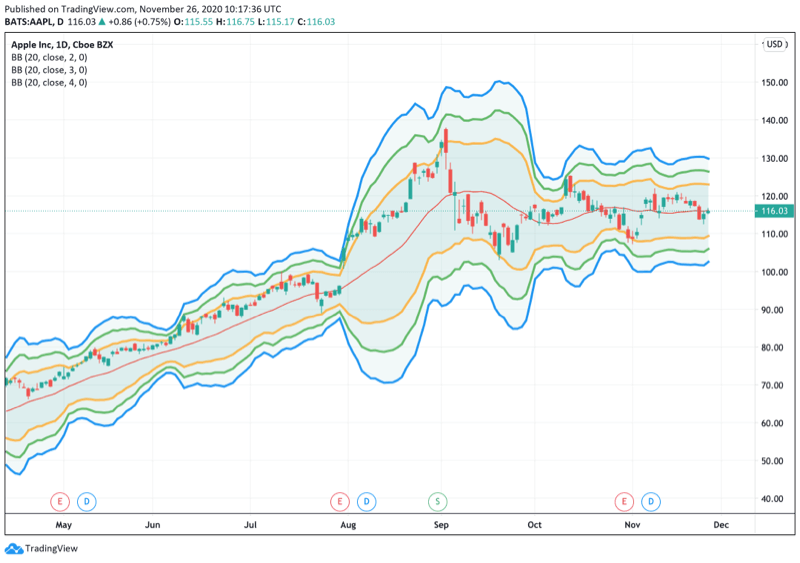
In the example above, we’re using 2, 3 and 4 Standard deviations. Changing the Standard Deviation multiplier simply means adding more standard deviations to the indicator.
Also, note that the more you increase the Standard Deviation Multiplier, the wider the bands will become as the measure becomes bigger.
How to use Bollinger Bands?
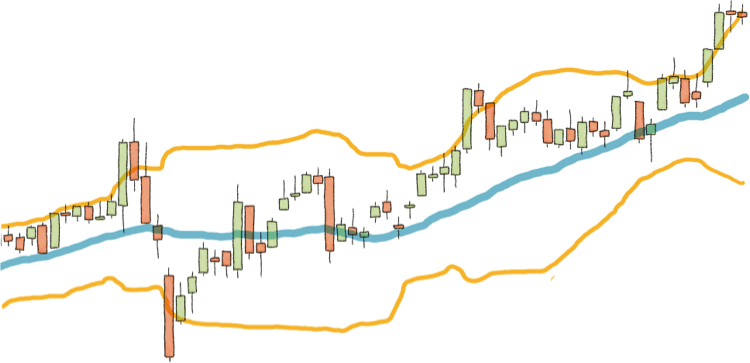
The first to know before learning how to use Bollinger Bands it's understanding how they behave. Bollinger bands have two well-known behavioural patterns: the squeeze and the breakout.
When Bollinger Bands are narrowing, we call that a squeeze and it's usually interpreted as a signal that a big market movement (volatility) may be coming. Here's how the squeeze looks like:

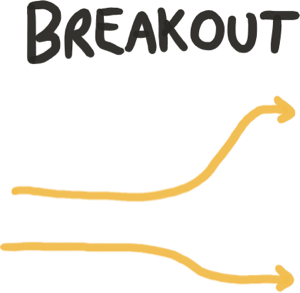
When Bollinger Bands are expanding, we call that a breakout and it's usually interpreted as a signal that volatility has arrived and the big market movement started. Here's how a breakout looks like:
A lot of new traders tend to gaze at Bollinger Bands and make the general assumption that when the price hits the upper band, it's a sell signal and when the price hit's the lower band, it's a buy signal. This can be right and wrong at the same time.
As John Bollinger describes it himself in his Bollinger Band's rules, the price can walk the upper or lower band during trending markets, look at the example above. So you could literally see the price moving closely to the line for a long period of time and make the mistake of interpreting it as a Sell Signal.
Here lies the importance of paying close attention to the behaviour of the bands to understand if we're dealing with a squeeze or with a breakout.
The best way to use bollinger bands is to combine them with other indicators and always base yourself on price action to complement the trading decisions that you take.
- Price Action is the ultimate form of technical analysis, nothing speaks louder than psychological levels of support and resistance and how traders make decisions based on them.
- When Bollinger Bands perform a squeeze it's usually a signal that large volatility is coming, in other words, major price changes.
- After that narrow squeeze, the breakout usually takes place, and that's the most effective point for bollinger bands to come into play.
This is just the basics and general knowledge of Bollinger Bands. Now that we've understood the basics and usage we can discuss how to calculate them and finally the most common trading strategies!
How to Calculate Bollinger Bands?
In order to calculate Bollinger bands we need to know the following formulas:
- Calculating the 20 Period Simple Moving Average
- Calculating the Standard Deviation
- Using the Standard Deviation to Calculate the Upper and Lower Bands.
Here we go:
Bollinger Bands Formula
In order to calculate a Standard Deviation we first need to figure out our X Bar. This is how people doing math approach it, but for us, X Bar is the same as our value for the simple moving average, so technically you could say that the formula is the same as the SMA Formula.

In the formula above:
- X Bar is our SMA Value.
- SUM equals the values of the periods we'll use. If we're using 20 Periods, then we must add the 20 values together.
- N equals the number of periods we are using, in this case, 20.
So the formula above is telling us to add all the values of our periods and divide it by the amount of periods we'll use.
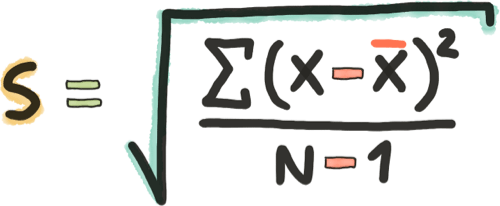
Next, the standard deviation, here's the formula:
Before continuing, if you feel curious about standard deviations, take a look at this very cool video that explains the notion of what is it.
In the formula above:
- S stands for Standard Deviation
- The first symbol inside the square root known as Sigma (Greek Letter) stands for summation, which means that whatever we're doing inside that parenthesis, we need to do it for each value we used to create the SUM in the previous formula and add them all together.
- X equals to each one of the numbers in our SUM. Every time we do the formula we need to insert in X each number one at a time.
- X Bar is our standard value that doesn't change that we calculated previously, for us traders, X Bar in this case means our Simple Moving Average Value.
- N stands for a number of periods, in the standard configuration we're always using 20.
Bottomline, here's what the formula is telling us to do:
Hey Trader, please take individually each one of the numbers you added together to create the SUM and process them individually one at a time inside the parenthesis of this formula, add the results of all these parentheses calculations together and divide them by the amount of periods that you chose (20) - 1.
To make this example simpler, imagine that you have 3 prices (20, 25, 22) and your 3 Period SMA is: 22.3
- Your SUM equals to 20 + 25 + 22 = 67
- Your X BAR equals 67/3 = 22.3
Now, to get the standard deviation you begin by inserting each value of your SMA and repeating the formula as we mentioned before:
- (20-22.3)^2 + (25-22.3)^2 + (22-22.3)^2
- 5.29+7.29+0.09 = 12.67 (this is the final solution to the parentheses in the formula)
- Now we divide 12.67 between N-1 which means our number of Periods minus one, in this case we're using 3 periods so:
- 12.67 Divided by 2
- The Result is 6.335
- To conclude, we square root 6.335 and get: 2.51694258973
Our First Standard Deviation Point is 2.51694258973
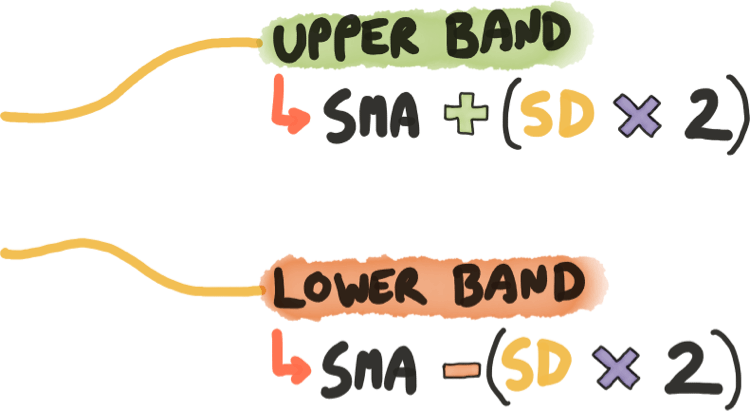
Now, in order to use this standard deviation to calculate the upper and lower bands, we use the following formula:
In our particular example we have the following results so far:
- SMA equals to 22.3
- Standard Deviation equals to 2.51694258973
So for the Upper Bollinger Band according the formula above, we do this:
- 22.3 + (2.51694258973*2)
- This means that our first upper bollinger band point is: 27.3338851795
And for the Lower Bollinger Band according the formula above, we do this:
- 22.3 - (2.51694258973*2)
- This means that our first lower bollinger band point is: 17.2661148205
And if you were to repeat this process with several values, you'll slowly acquire many many points which you can begin to plot on a chart and draw lines from, and that's how Bollinger Bands are calculated.
Now we'll look at a more complex example using spreadsheet software.
Calculating Bollinger Bands using a Spreadsheet Software
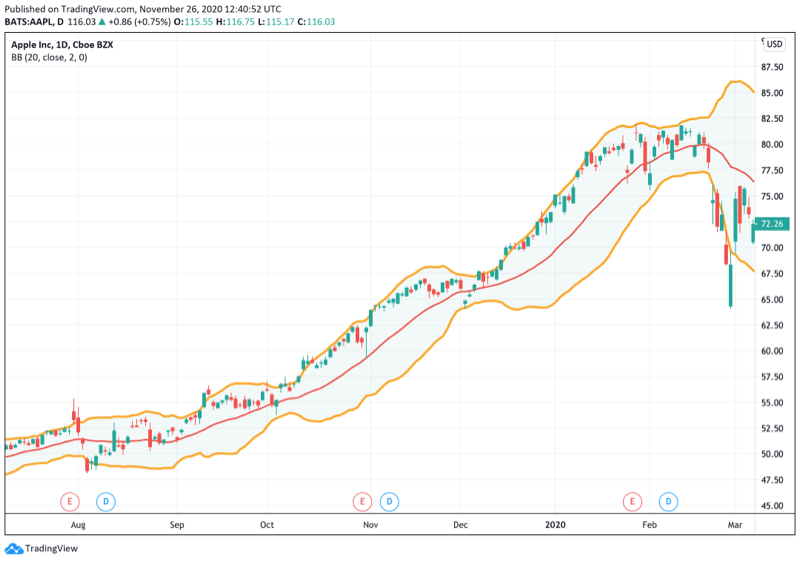
The first thing you need in order to calculate Bollinger Bands using spreadsheet software is data, lots of data!
Luckily for us, using Yahoo Finance we can download a massive CSV (same as Excel) file with all the data we need.
It would be amazing if you follow the exercise by doing the same thing on your PC, it will help you practise.
To start:
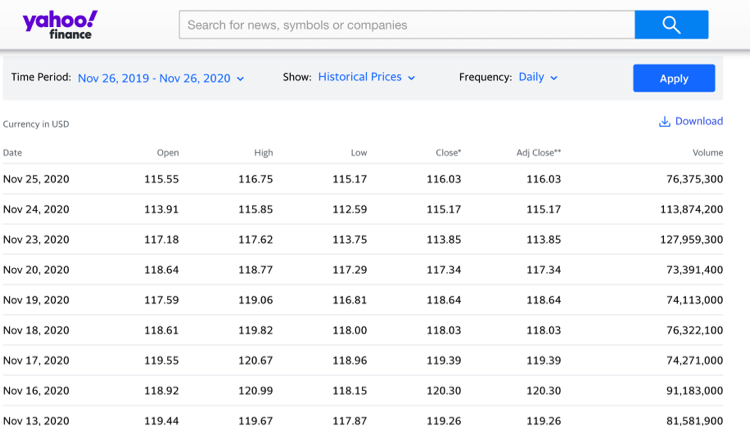
- Click on the link in order to go to Yahoo Finance Historical Data page on AAPL (Apple's Stock).
- Click on Download on the top right corner of the Table (as seen in the image above).
After downloading, you should have something like this:
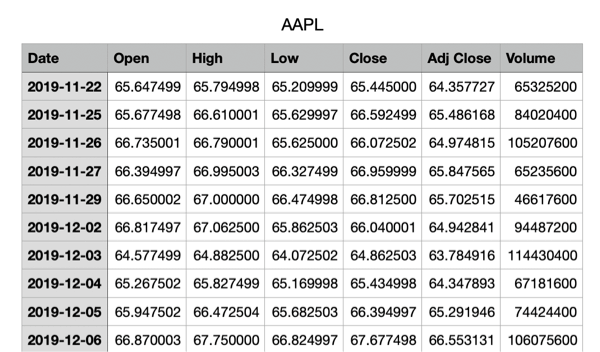
Now, proceed to delete the following columns:
- Open
- High
- Low
- Adj Close
- Volume
All that data is great, but we don't need it for our calculations. We'll only use the Date and Closing Prices.
Now, proceed to create new columns next to Date and Closing Prices in the following order:
- Simple Moving Average
- Standard Deviation
- Upper Band
- Lower Band
You should have something like this (of course, without the data as you haven't calculated it yet).
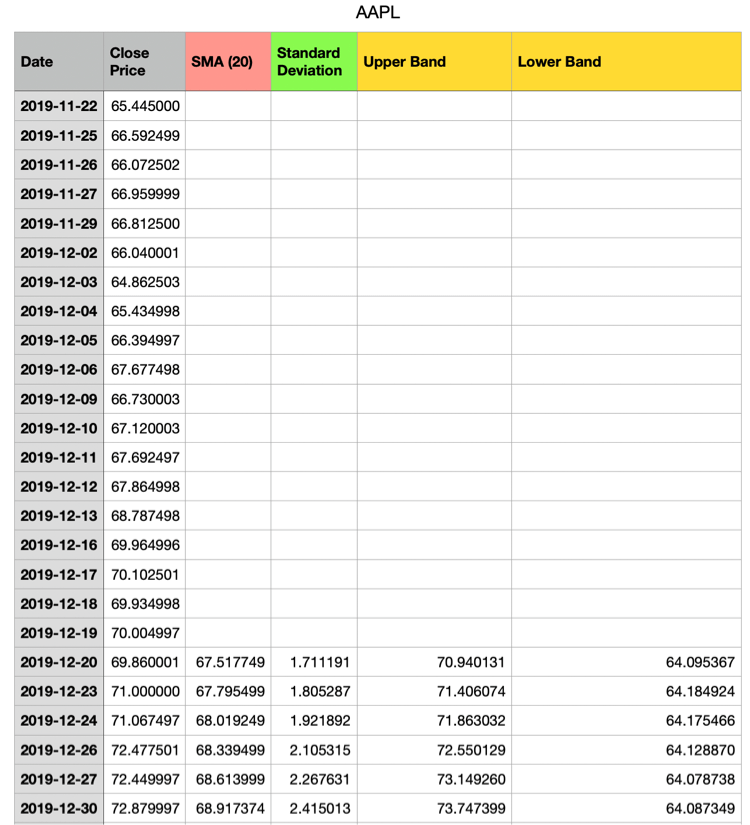
Let the magic begin! In order to calculate your bollinger bands using a spreadsheet software, follow this steps:
- Calculate the 20 Period SMA , it will be your starting point, then replicate the calculation on each cell below, usually spreadsheet softwares do this automatically when you copy and paste the formula.
- For the Standard deviation, you can do it automatically using the STDEV formula and choosing the first 20 values of your CLOSING PRICES. Remember the SUM in the formula above? It's each value used to make the SMA, so those are the sames we use inside the STDEV formula.
- If you're brave, you can also write manually the formula for each value in order to test it and calculate it truly manually, but that's a waste of time.
- Now that you have your first standard deviation, begin with the upper band using the formula we presented above in the article.
- Upper Band equals to SMA + (Standard Deviation * 2)
- Lower Band equals to SMA - (Standard Deviation *2)
- And that's it! Rinse and repeat the formula on the cells below and you have all the data points to plot your lines on a chart and bring your Bollinger Bands to life!
Here's how our spreadsheet made Bollinger Bands look like:
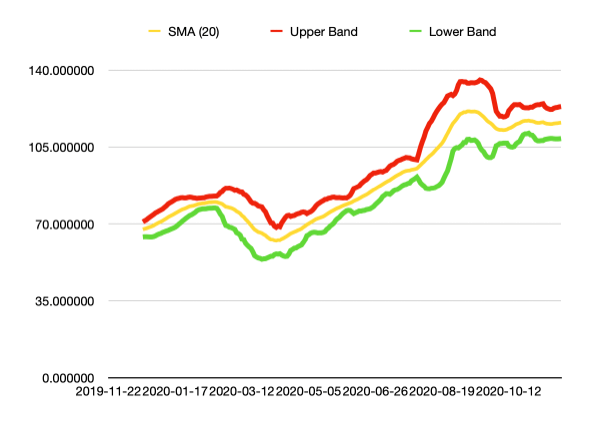
Remember that we're using 2 as our multiplier, if you changed the multiplier to 3, or 4, that means you're using that number of standard deviations and the bands would become wider.
Bollinger Bands Trading Strategies
The most common Bollinger Bands Trading Strategies are the overbought and oversold approach, the squeeze and using Multiple Bollinger Bands on different standard deviations.
Make no mistake, Bollinger Bands are not meant to be used as a stand alone indicator, there needs to be other factors confirming the signal in order to get the most accurate price forecasts possible.
Let's talk about each strategy:
Bollinger Bands Squeeze Trading Strategy
As we talked about before, bollinger bands have two main behavioural patterns, the squeeze and the breakout.
- When the bands narrow, we call it squeeze and it means that there's not much volatility going on and there could be a big movement happening soon.
- When the bands expand, we call it a breakout and it means that volatility went nuts and there is a huge market movement happening.
In the chart below, notice how the Bollinger Bands are on a squeeze pattern and suddenly BOOM! They expand and the party gets started.
You must be wondering something, but how do I know after the squeeze in which direction could the market go?
Simple, you still base yourself on classic technical analysis and price action in order to detect the initial trend direction and go along with it.
Bollinger Bands are just providing you entry and exit points that you need to know how to match with the current trend.
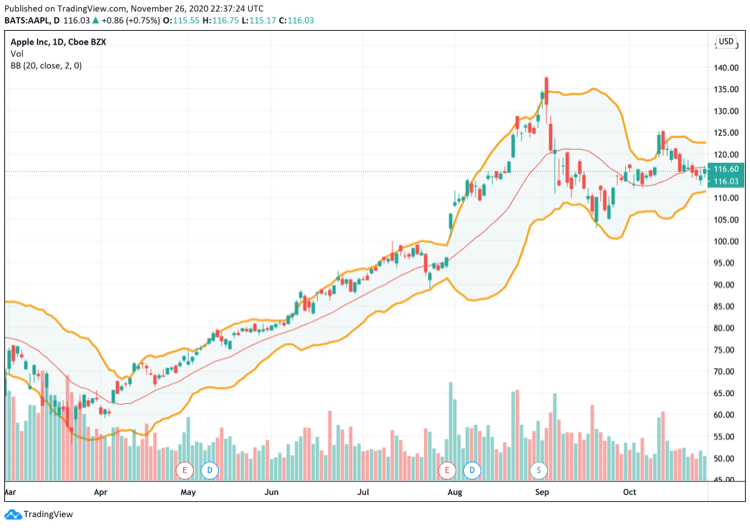
Overbought and Oversold Trading Strategy with Bollinger Bands
When an asset is overbought that means that there is too much buying going on, in other words, expensive.
When an asset is oversold that means that there is too much selling going on, in other words, cheap.
The whole point of Bollinger Bands is to track how far away the prices are from the average (SMA) and within the limits set by the standard deviation in order to understand if something is expensive or cheap.
Take a look at this example:
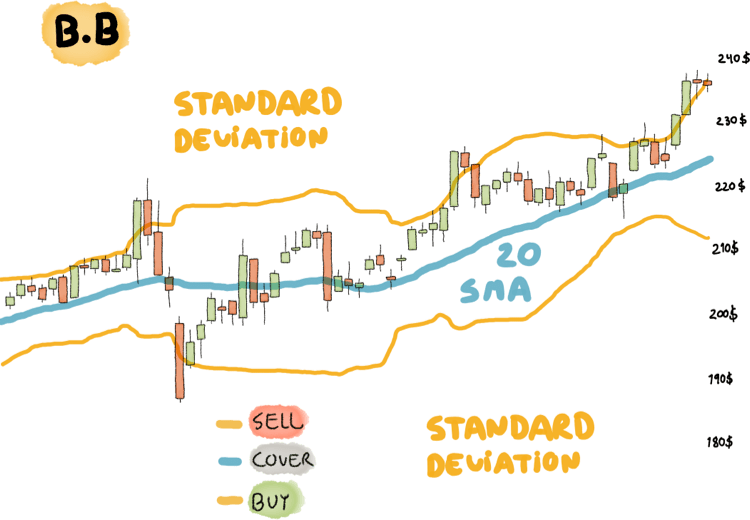
Note how the price touches in both cases the upper or lower band and bounces back, right?
Great, now, remember, the overbought and oversold Bollinger Bands strategy is not that simple, remember that an asset can end up walking the Band for months during a trending market.
The standard approach that many traders use for this strategy is:
- During a Bullish (going up) market traders look to go long when the price hits the lower band.
- During a Bearish (going down) market traders look to go short when the price hits the upper band.
Look at the very important keywords, bullish or bearish. And by bullish or bearish we mean a proper trend with momentum. When an asset is trending and going into a clear direction the SMA should be pointing towards that direction in a clearly visible manner.
Note also that in the image above we have the SELL, COVER, BUY tags. That's because also many traders chose to use stop losses for shorter term trades right at the SMA.
This is a matter of preference. Go and test as much as possible using a demo trading platform to see how this strategy fits you best!
Conclusion
Bollinger Bands are a unique technical analysis indicator that allows us to determine the overbought (expensive) and oversold (cheap) levels of an asset by checking how far away from the average price are the current prices.
The beauty of Bollinger bands is that it checks this inside a standard deviation limit that tells us what mathematically makes sense in terms of the appropriate distance from the SMA.
If used correctly they can be a great tool in forecasting future prices but you must remember:
- NEVER use Bollinger Bands Alone, combine them with some other form of analysis
- Price action is the ultimate analysis tool. Support and Resistance levels combined with Bollinger Bands will get you closer to figuring out the puzzle.
- Prices can WALK the Band for months in a trending market, just because the price reaches the upper or lower band it automatically means that you've encountered a sell or buy signal.
- The Trend is your friend, ultimately this piece of knowledge will drive most of your decisions. Cross check every trading decision against the trend and complement your entry and exit timing using Bollinger Bands.
Frequently Asked Questions
Can Bollinger Bands be used alone?
It's not advisable to base yourself solely on Bollinger Bands in order to make trading decisions. John Bollinger explains that Bollinger Bands are not a standalone indicator and should always be used in combination with others.
What are the most used indicators in combination with Bollinger Bands?
The most common combination with Bollinger Bands is the RSI (Relative Strength Index). If you know our philosophy then you'll remember that we always recommend performing your own studies and tests in order to find what works best for you. Just because people say that Bollinger Bands are great when combined with RSI doesn't mean you should accept it as an absolute truth, go run your tests first!
What are the scalping settings for Bollinger Bands?
Scalpers using Bollinger Bands configure them with the default settings of a 20 Period Simple Moving Average and a Standard Deviation Multiplier of 2. The main change is that they apply this bollinger bands on a 5 minute candlestick chart (each candle is worth 5 minutes of trading data).
Then they proceed to trade on Bollinger Bands when the market is trading in Range (flat) and use the upper band as a sell signal and the lower band as a buy signal.
Remember, always test other people's strategies in a demo trading platform before taking any risks so you're sure that it actually works for you!