The Trading Bible Trading Guides ᑕ❶ᑐ VWAP Meaning - What Is VWAP in Trading
What Is VWAP Indicator in Trading
By Stelian Olar, Updated on: Feb 17 2026.
Traders constantly seek tools and indicators to gain an edge. Understanding market sentiment, identifying fair value, and timing entries and exits are crucial for success. One such tool, particularly favored by day traders and institutional traders alike, is the Volume-Weighted Average Price, or VWAP.
If you've ever wondered what is VWAP or how this powerful VWAP indicator can transform your trading strategies, you're in the right place. This article will serve as your best guide for trading VWAP, demystifying the VWAP meaning, calculation, and practical applications in today's markets, including VWAP in stocks and VWAP for futures. We'll explore what is a VWAP and why understanding VWAP mean is critical for interpreting price action.
VWAP Meaning - Volume-Weighted Average Price Indicator
So, what is VWAP? The acronym VWAP stands for Volume Weighted Average Price. At its core, the VWAP indicator represents the average market price a security has traded at throughout the trading day, based on both price and cumulative volume. Essentially, it provides a benchmark that shows the true average price paid for a stock, giving more weight to price levels where higher volume has occurred.
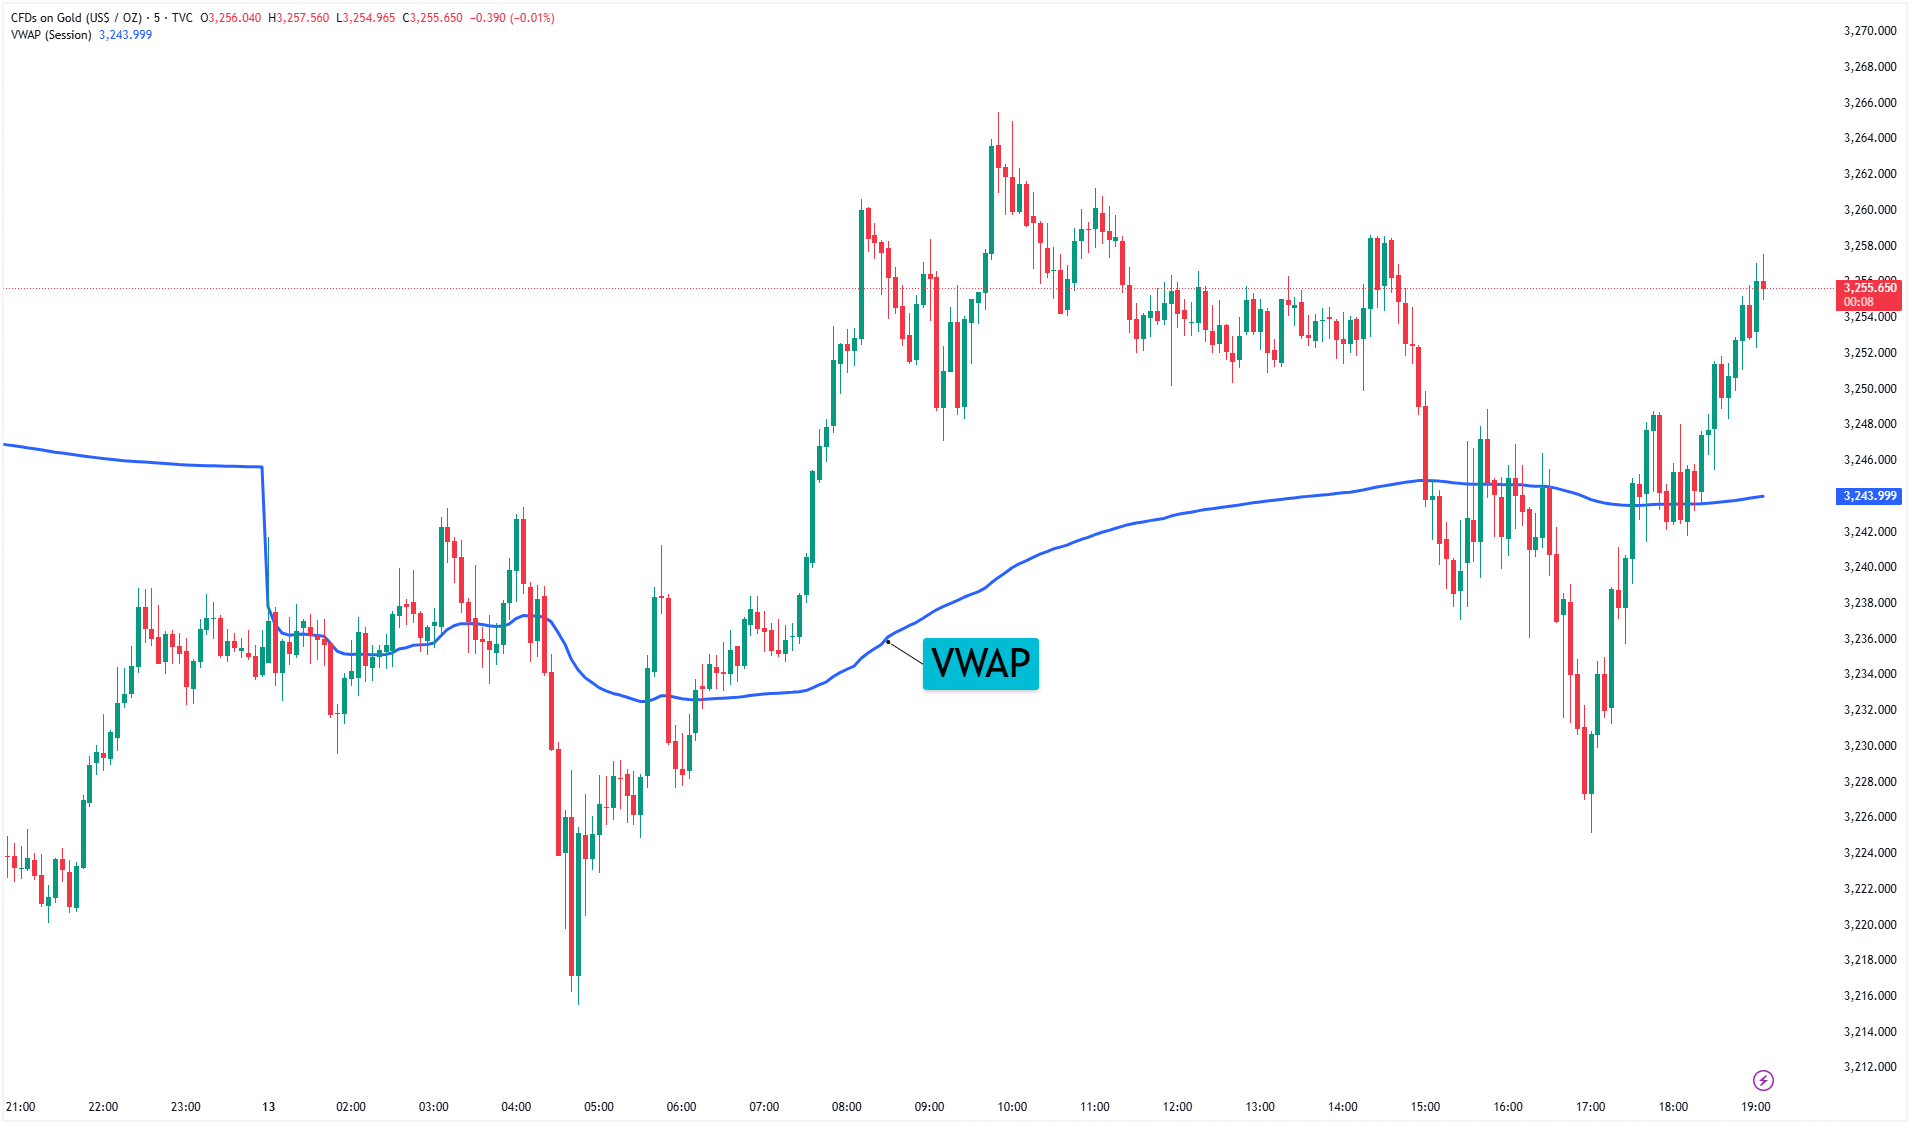
The VWAP line, when plotted on a chart, offers a visual reference point. Unlike simple moving averages that only consider closing prices, the VWAP in stocks and other tradable assets incorporates volume into its very fabric, offering a more nuanced perspective on price action. Many traders ask, "what is a VWAP and why is it significant?" Its significance lies in its widespread use as a benchmark, particularly by large institutions looking to execute big orders. These entities often aim to minimize market impact by buying below the VWAP or selling above it, thereby pushing the price back towards this volume-weighted average. Understanding the VWAP mean helps traders gauge where the "fair" value, as perceived by the collective market, might lie during a specific time period.
Is VWAP Bullish or Bearish?
The interpretation of the VWAP in terms of market sentiment is relatively straightforward. When the current market price of a security is trading above the VWAP line, it is generally considered a bullish signal. In such scenarios, the VWAP line can often act as a dynamic support level during pullbacks in an uptrend.
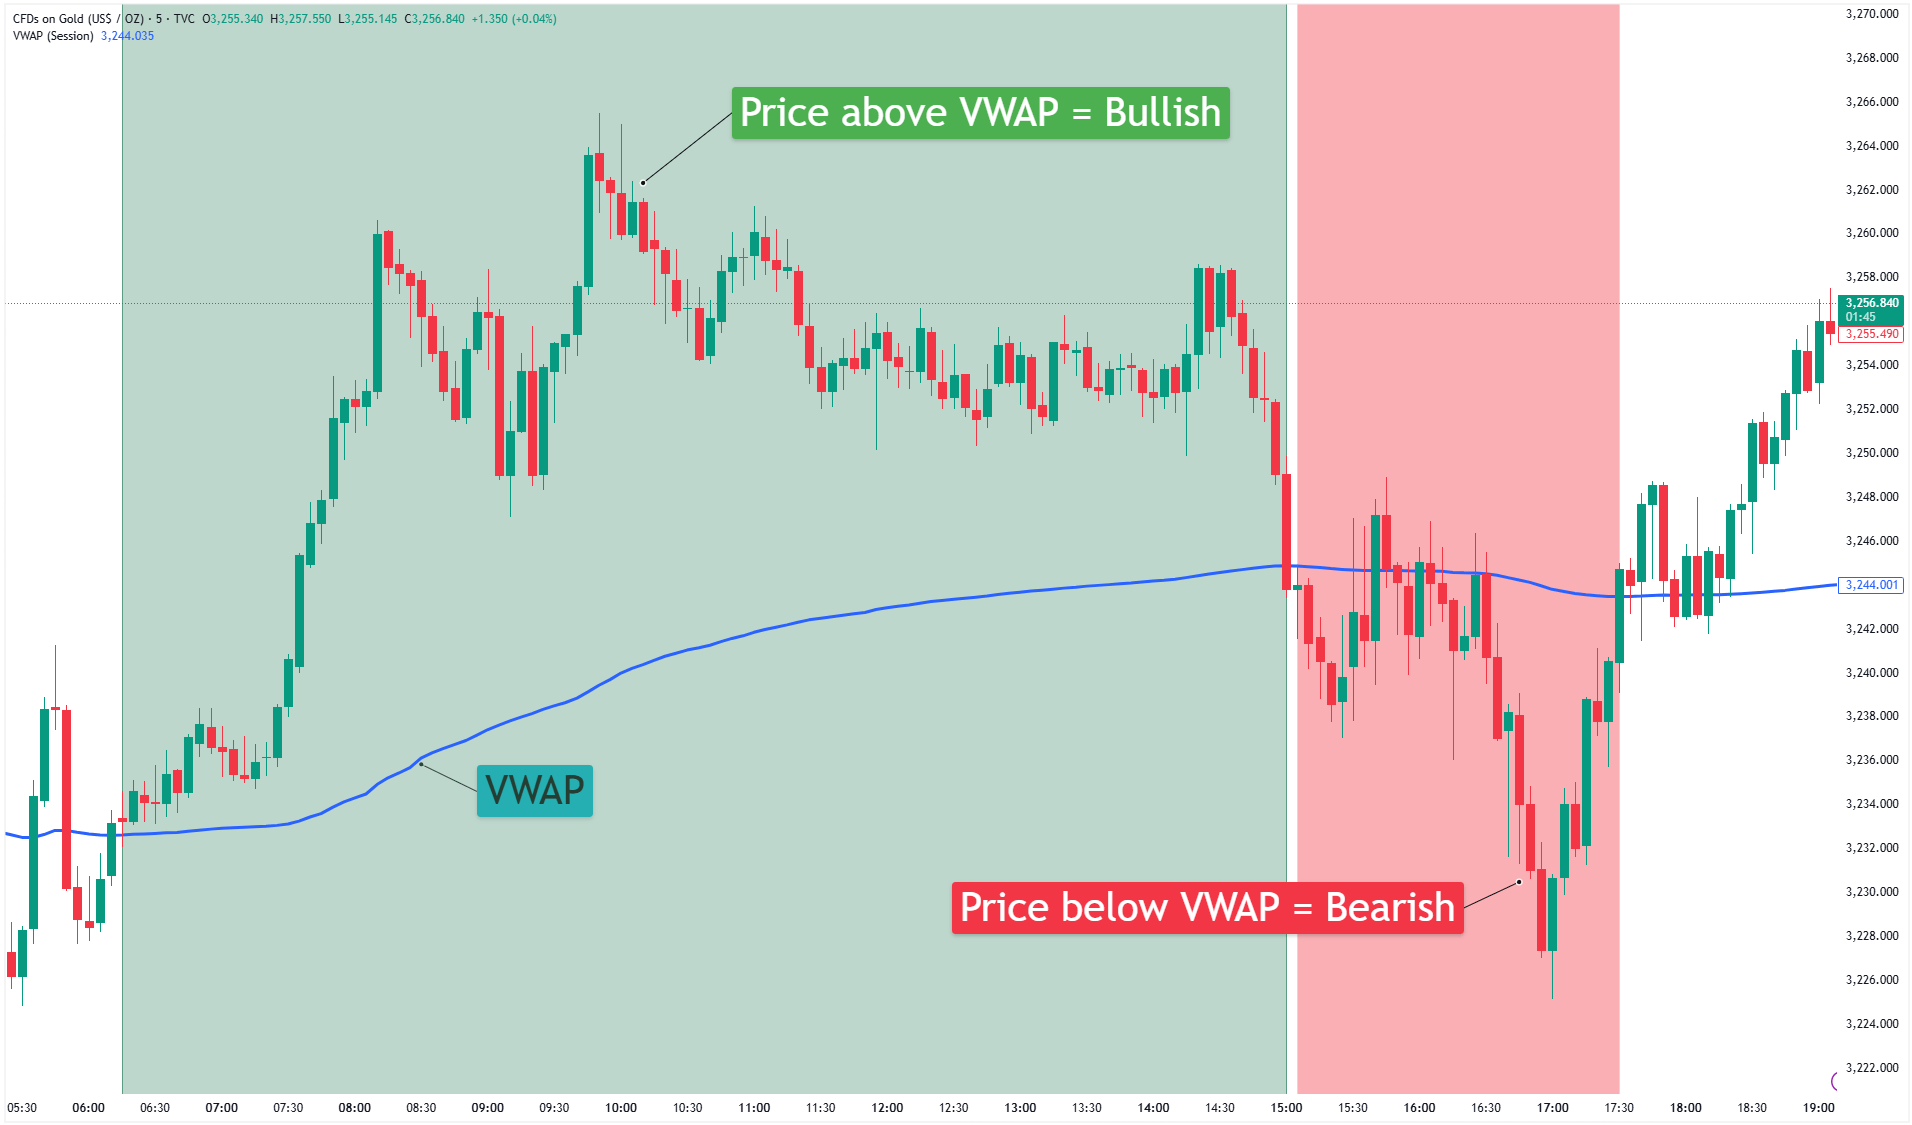
Conversely, if the price is trading below the VWAP line, it is typically viewed as a bearish signal. This indicates that sellers are in control, pushing the price below the average level where significant volume has occurred. In this context, the VWAP can act as a dynamic resistance levels during rallies in a downtrend. The decision to buy or sell can be influenced by this relationship, with traders observing the price movement relative to the VWAP to confirm or question their biases.
Is VWAP Better than EMA?
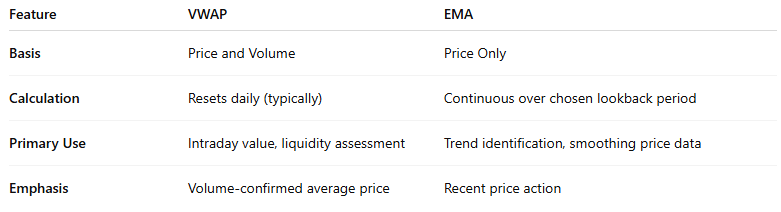
A common question among traders is whether VWAP is superior to other types of moving averages, such as the Exponential Moving Average (EMA). While both are trend-following VWAP indicators, they are fundamentally different in their calculation and emphasis. An EMA gives more weight to recent closing prices, making it responsive to new price information. However, it does not directly account for trading volume.
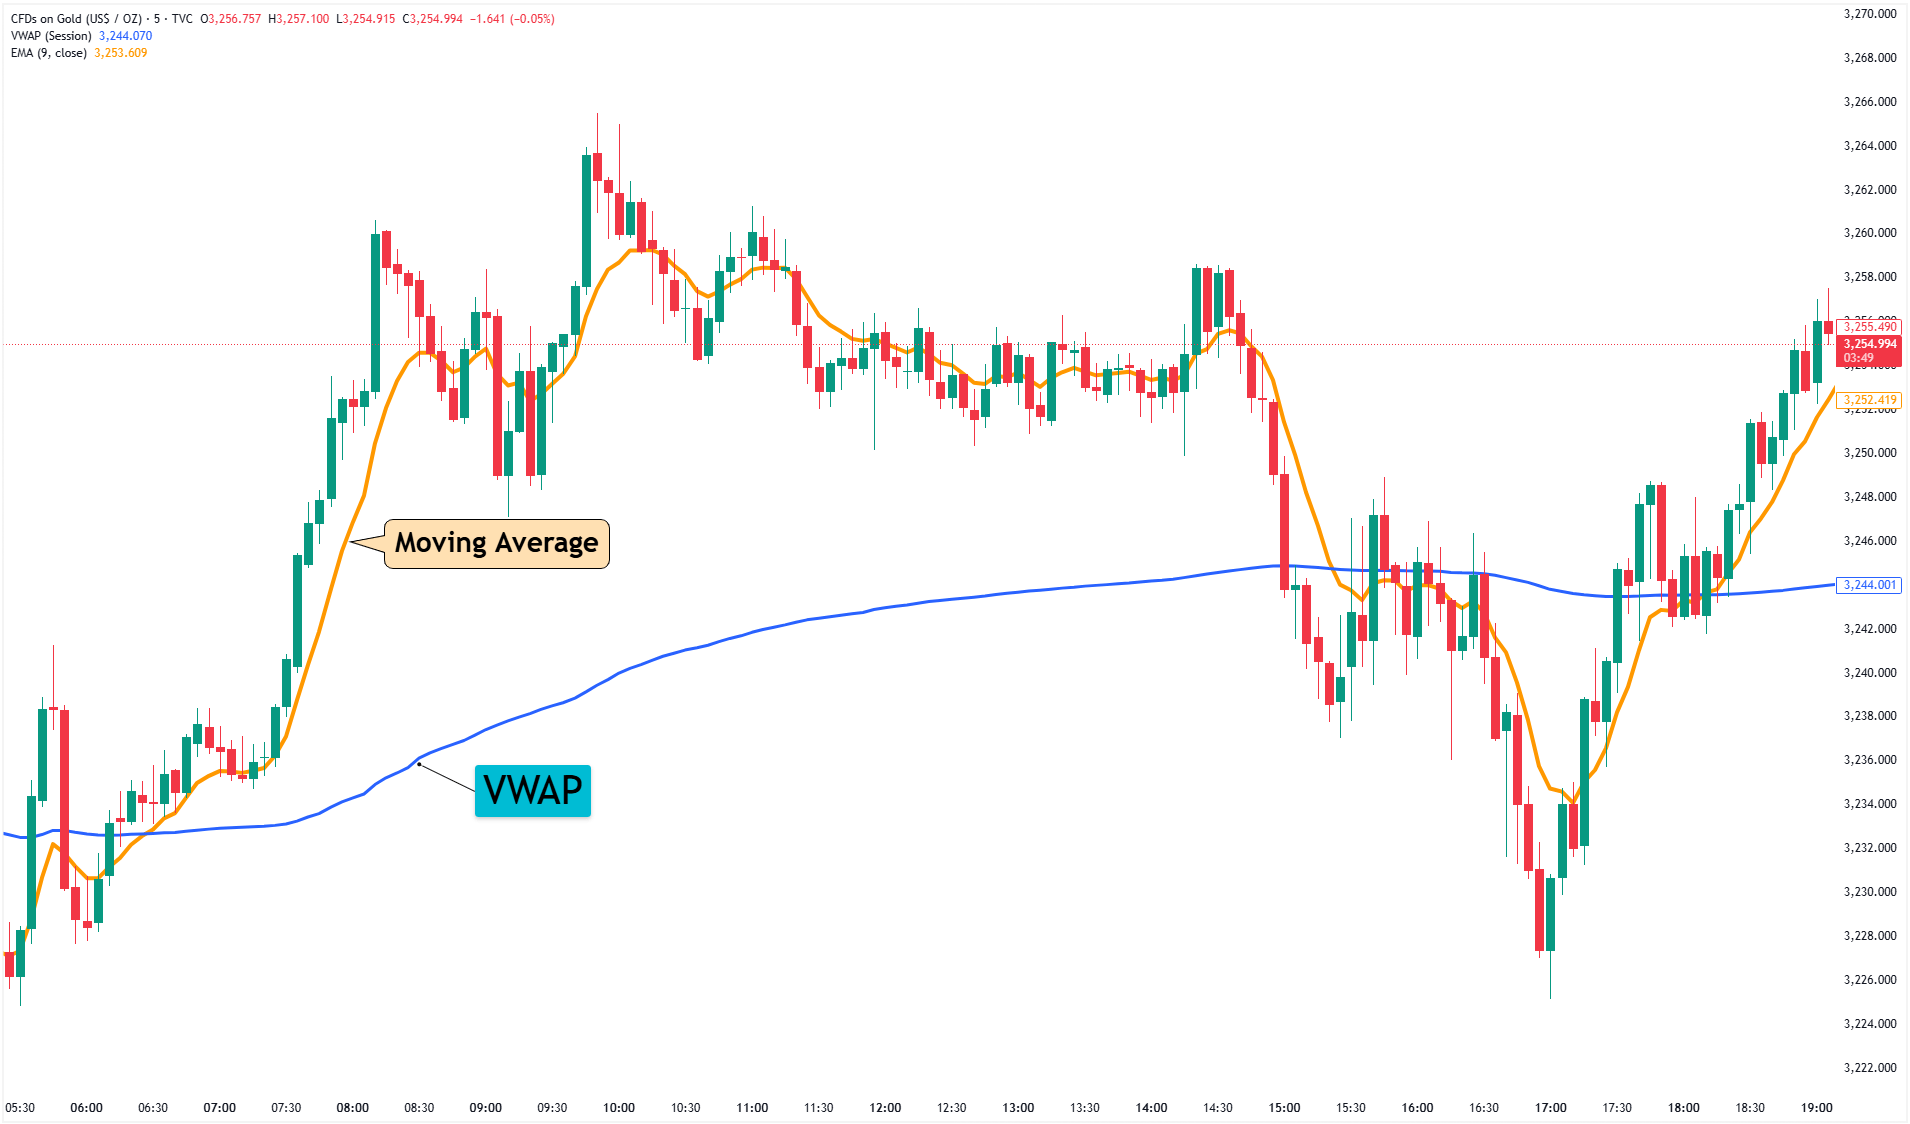
The primary advantage of VWAP lies in its incorporation of cumulative volume. This means that price levels with higher trading activity have a greater influence on the average. For traders focusing on liquidity and the impact of large orders, VWAP often provides a more relevant benchmark within a single trading day.
While EMA can be useful for identifying trends over various time frame options and is smoother, VWAP in trading offers a unique perspective on price relative to transactional weight. Some traders also consider TWAP vs VWAP (Time Weighted Average Price).
TWAP breaks down a large order into smaller clips executed at regular time intervals, aiming for an average price over time without considering volume at specific price points. The choice between VWAP and EMA (or other MAs) often depends on the trader's specific trading strategies and what information they prioritize.
VWAP Formula
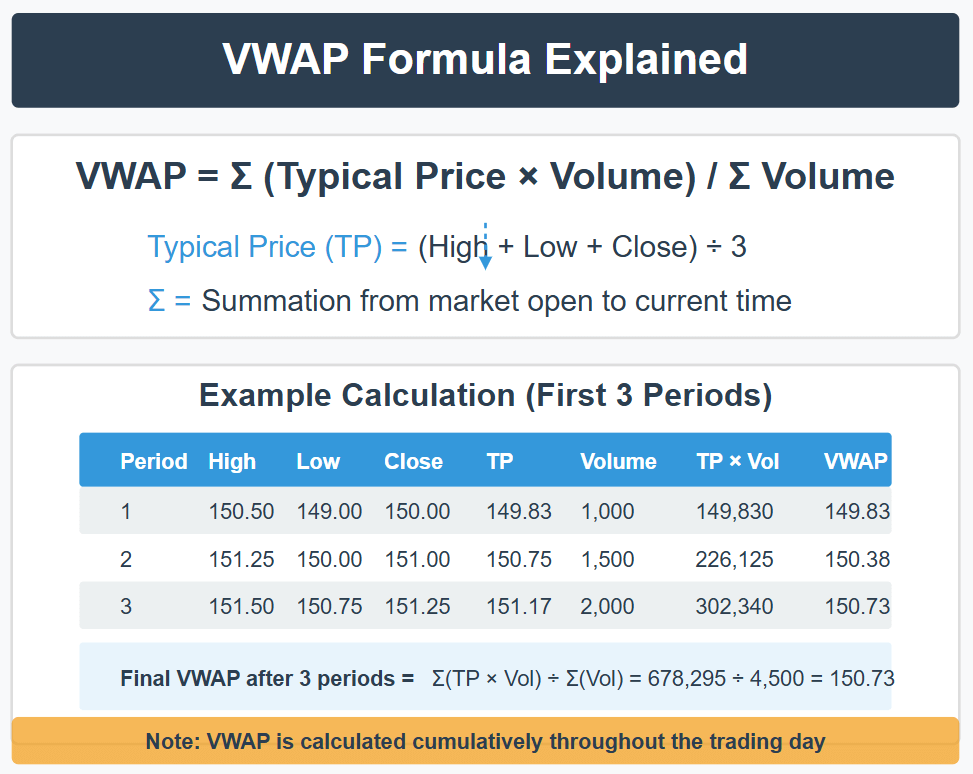
Understanding the VWAP formula is key to appreciating how this indicator derives its value. While most charting platforms automate the VWAP calculation, knowing the underlying mechanics provides deeper insight. The standard formula to derive the VWAP is:
VWAP = Σ (Typical Price * Volume) / Σ Volume (or Total Volume)
Where:
- Typical Price (TP) = (High + Low + Close) / 3 for each period.
- Volume (V) = Volume traded during that same period.
- Σ represents the summation over the chosen time period, which for the standard VWAP is cumulative from the market open.
This VWAP formula essentially calculates a running weighted average price VWAP throughout the trading day.
How to Calculate VWAP
To manually calculate VWAP, or to understand how charting software arrives at the VWAP line, one would follow these conceptual steps, typically applied to an intraday time frame (e.g., 1-minute, 5-minute, or 15-minute bars):
- Determine the Typical Price for the Period: For the first period of the trading day (e.g., the first 5-minute candle), calculate the Typical Price: (High + Low + Close) / 3.
- Multiply by Volume: Multiply this Typical Price by the volume traded during that first period. This gives you Price-Volume (PV) for that bar.
- Calculate Initial VWAP: For the very first period, the VWAP is simply the Typical Price (as cumulative volume equals the first period's volume, which cancels out in the PV/V calculation for a single period) Cumulative.
Calculation for each subsequent period:
- Calculate the Typical Price for the current period.
- Multiply this Typical Price by the volume for the current period to get its PV.
- Add the current period's PV to the sum of all previous PVs (Cumulative PV).
- Add the current period's volume to the sum of all previous volumes (Cumulative Volume or Total Volume since open).
- Divide the Cumulative PV by the Cumulative Volume. This result is the updated VWAP.
This process is repeated for every new bar throughout the trading day, causing the VWAP line to adjust with each new set of price and volume data. It's important to note that the standard VWAP calculation resets at the beginning of each new trading day.
However, traders sometimes use an anchored VWAP. The anchored VWAP allows the user to select a specific starting point for the calculation, other than the session open, such as a significant news event, a key high or low, or even the previous day's close or OVN low (Overnight Low). This provides flexibility in analyzing price action from a chosen anchor point, and learning how do I see OVN low with VWAP often involves manually marking the OVN low and observing how the current day's VWAP (or an anchored VWAP from the open) interacts with it.
What Is VAL in Trading VWAP
When discussing VWAP trading, you might encounter the term VAL. What is VAL in trading VWAP? VAL typically refers to "Value Area Lines" or "VWAP Standard Deviation Bands." These are lines plotted above and below the main VWAP line at specific standard deviation intervals. For instance, a charting platform might allow you to plot bands at +1/-1, +2/-2, and +3/-3 standard deviations from the VWAP.
These VAL bands or VWAP deviation bands create a sort of dynamic channel around the VWAP line. Traders use these bands in several ways:
- Identifying Overbought/Oversold Conditions
- Setting Profit Targets: For example, a long position initiated at VWAP might target the +1 or +2 standard deviation band.
- Gauging Volatility
- Support and Resistance Zones: Like the VWAP itself, these bands can act as dynamic support levels and resistance levels.
Understanding VAL in the context of the VWAP indicator enhances its utility by providing statistically derived levels that can aid in decision-making and risk management.
Best VWAP Settings for Day Trading
For day traders, the VWAP is an invaluable tool. When considering the best VWAP settings for day trading, the standard, session-based VWAP (calculated from the market open and resetting daily) is typically the default and most widely used. This is because it reflects the entire trading day's activity up to the current moment.
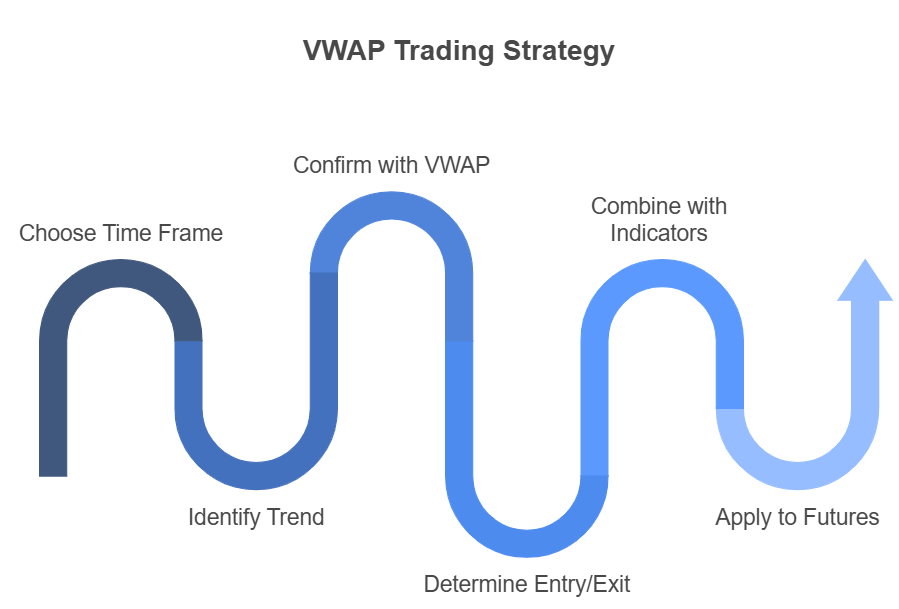
Here are some considerations for using VWAP in trading, particularly for intraday setups:
- Time Frame: VWAP is most effective on intraday charts. Common time frame choices include 1-minute, 5-minute, and 15-minute charts. The VWAP on a 1-day chart (meaning an intraday chart spanning one day) will show the evolving average price.
- Confirmation Tool: Use the VWAP line to confirm trends. If you identify an uptrend based on price action, look for the price to remain above VWAP. For downtrends, expect the price to stay below VWAP.
- Entry and Exit Points
- Combining with Other Indicators
- VWAP for Futures: The VWAP for futures trading is equally popular, given the high volume and institutional participation in futures markets.
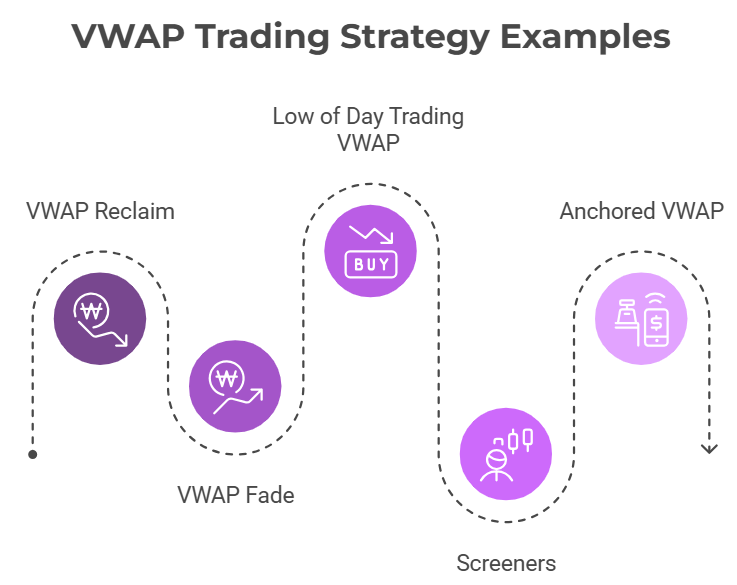
VWAP Trading Strategy Examples:
- VWAP Reclaim: Price dips below VWAP but then reclaims it with conviction, suggesting a failed breakdown and a potential entry for long positions.
- VWAP Fade: Price extends far from VWAP (e.g., to an upper deviation band) and shows signs of reversal, offering a mean-reversion trade back towards the VWAP.
- What is low of day trading VWAP? This can refer to scenarios where the price approaches the day's low. If VWAP is above the price and acting as resistance, it might confirm bearish pressure. Alternatively, if price bounces off the low and reclaims VWAP, it could signal a reversal from the low.
- Screeners: Many traders use a screener touching VWAP to find stocks that are currently interacting with their VWAP, potentially setting up for a trade based on their VWAP strategy.
- Anchored VWAP: As mentioned, for specific scenarios, the anchored VWAP can be one of the best VWAP settings for day trading if a trader wants to analyze price from a key event time rather than just the open. For instance, after a major news release or if observing how price reacts relative to an OVN low (Overnight Low), anchoring VWAP from the day's open and comparing its position to the OVN low can be insightful.
Understanding what is VWAP trading involves recognizing that VWAP is not just a line on a chart but a reflection of where significant value has been exchanged. This best guide for trading VWAP aims to equip you with the foundational knowledge to effectively incorporate this powerful tool.
Understanding VWAP is the first step. The next is having the right platform to track it accurately and execute your trades. To apply the VWAP strategies discussed, compare the features and tools offered by these best forex brokers: Pepperstone, FP Markets or Deriv.